
Figure 5.
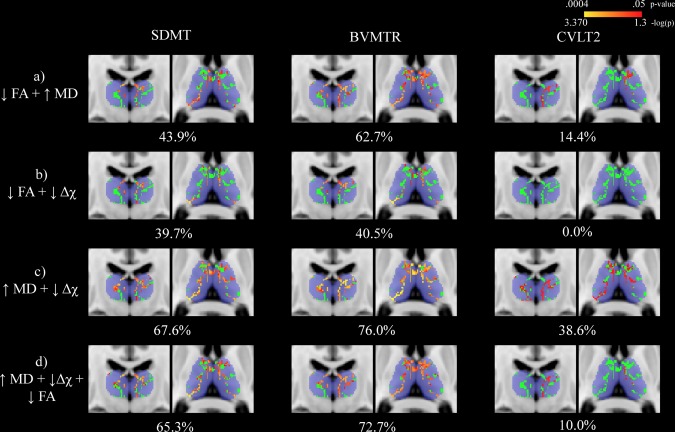
Nonparametric combination voxel‐wise analysis assessing the relationship between cognitive assessment performance and thalamic white matter (WM) metrics in multiple sclerosis (MS) patients. The thalamic WM skeleton is shown in green overlaid onto of the Harvard‐Oxford thalamic ROI in blue. Significant differences (p < .05) are shown in red‐yellow with p‐values having been log transformed for improved visibility. Warmer colors are indicative of smaller p‐values. Percentages refer to the proportion of voxels significantly associated with performance. The slices shown corresponds to standard space MNI coordinates of Y = −17, Z = 8. Abbreviations: SDMT = Symbol Digit Modalities Test; BVMTR = Brief Visual Memory Test ? Revised; CVLT2 = California Verbal Learning Test ‐ 2nd edition; FA = fractional anisotropy; MD = mean diffusivity; Δχ = magnetic susceptibility; HC = healthy control [Color figure can be viewed at http://wileyonlinelibrary.com]