
Figure 2.
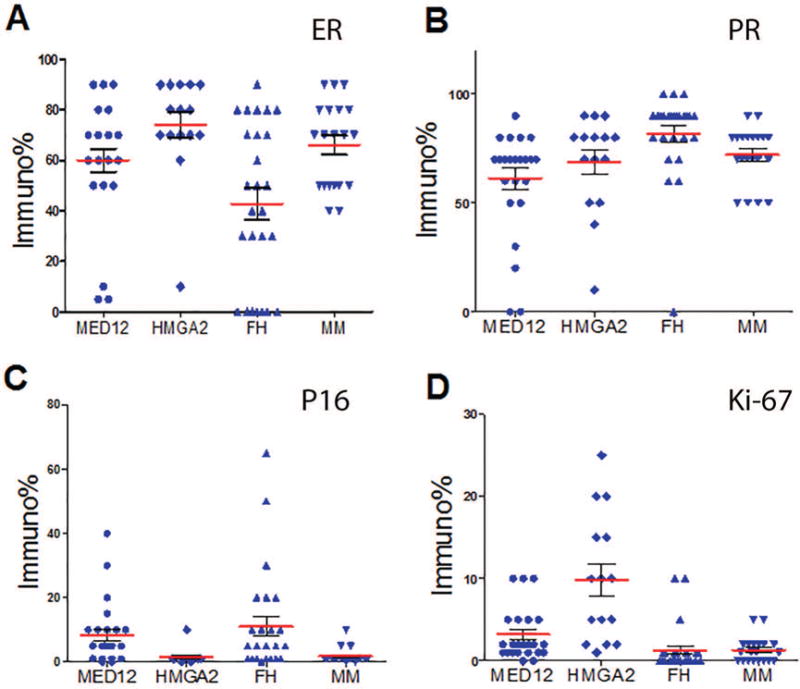
Expression analysis of ER, PR, P16 and Ki-67 by immunohistochemistry in ULM with three different driver gene mutations/alteration. Dot plot illustration of estrogen receptor (ER, A), progesterone receptor (PR, B), P16 (C) Ki-67 (D) expression by immunopercentage in ULM with MED12 mutation (rounded dot), HMGA2 overexpression (diagonal dot), loss of fumarate hydratase (FH) (upward triangle dot) and myometrium (downward triangle dot). Mean expression levels (Red line) and standard errors (short black line) for each tumor type are shown.