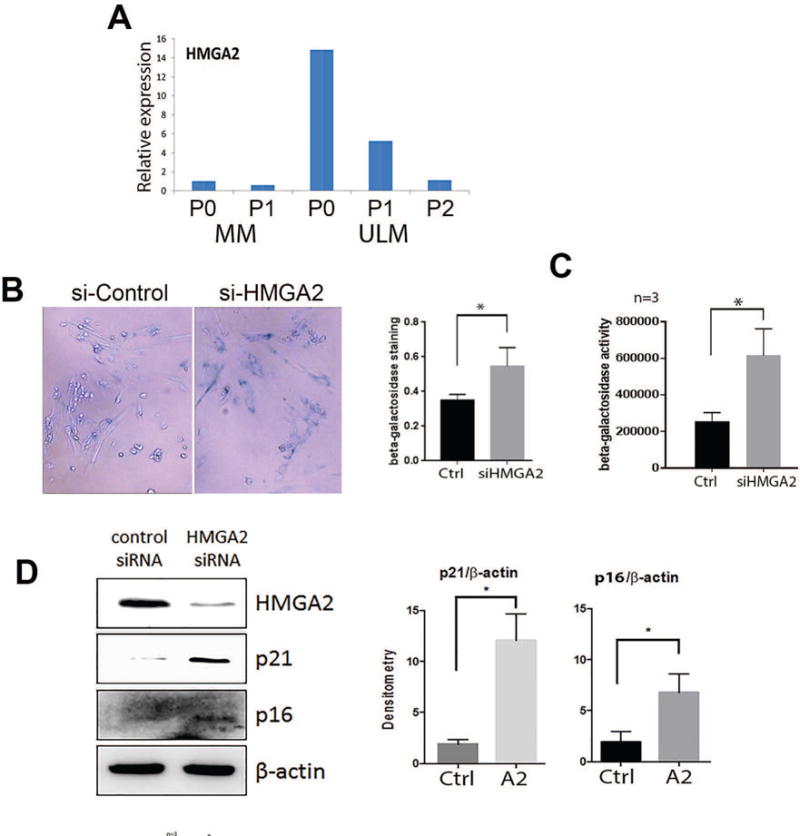
Figure 5.

HMGA2 and cellular senescence in primary ULM cells. A. HMGA2 expression by real-time RT-PCR in myometrial (MM) and leiomyoma (ULM) cells in P0 (not passaged), P1 (passage 1) and P2 (passage 2) cultures. B. β-galactosidase staining of senescent primary leiomyoma cells after silencing of HMGA2 by siRNA. C. Senescence in primary leiomyoma cells with silencing of HMGA2 by siRNA measured by β-galactosidase activity. D. Repression of HMGA2 expression by siRNA increases p21 and p16 expression. Histobar panels illustrate the relative expression and significant differences between controls (Ctrl) and HMGA siRNA (A2) and MK2206 (MK) after normalized either total AKT or β-actin.
