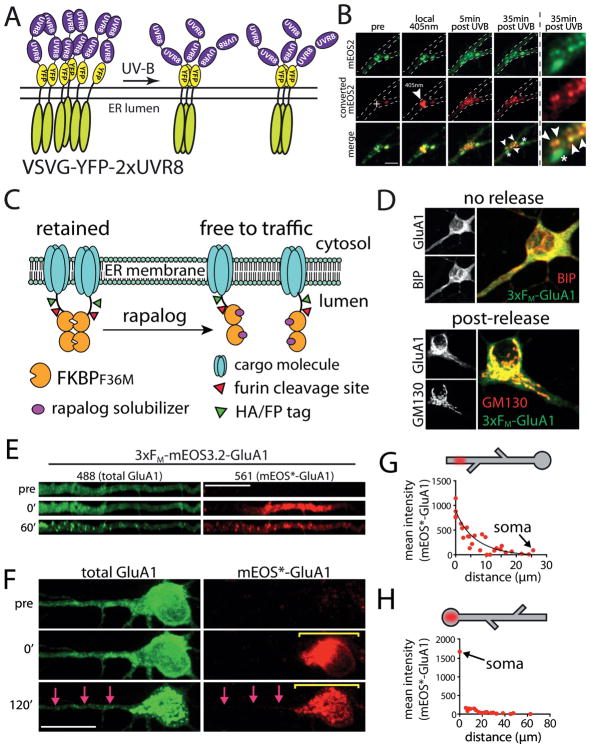
Figure 2. Inducible release systems to study the local dendritic secretory network.
(A) Schematic of the light-inducible release system based on conditional clustering of UVR8. When tandem copies of UVR8 are fused to a target protein (in this case, VSVG) oligomers form and are retained in the ER. Exposure to UV-B triggers dissociation of these clusters, allowing forward trafficking through the secretory pathway. Adapted from Chen et al., (2013) and reprinted with permission from Rockefeller University Press.
(B) Demonstration of the UVR8-dependent ER-retention strategy. ER-retained secretory cargo near dendritic branch points was selectively photoconverted from green to red with local 405-nm illumination (crosshair, middle) and then released with global UV-B. Photoconverted cargo accumulated at nearby secretory organelles after UV-B treatment (arrowheads), supporting a local secretory network in dendrites. Not all puncta contained photoconverted cargo (asterisks), indicating selective trafficking to a subset of secretory organelles. Scale bar, 4 μm. Adapted from Chen et al., (2013) and reprinted with permission from Rockefeller University Press.
(C) Schematic for the chemically-inducible release system based on the self-associating FKBP mutant (FM) and rapalog. FM domains cluster and trap fused cargo molecules in the ER. Addition of the rapalog compound disrupts FM clusters, allowing ER exit and subsequent trafficking.
(D) FM-GluA1 colocalizes with ER marker BIP prior to release and with the GA marker GM130 1 hr following rapalog addition. Adapted from Bowen et al., (2017) and reprinted with permission from eLife.
(E–H) Demonstration of the FM/rapalog inducible release strategy. FM-mEOS-GluA1 was photoconverted from green to red in either the apical dendrite (E) or the soma (F) prior to ER release. Upon ER release, the cargo redistributes to local trafficking organelles. Quantification of the signal distribution relative to the original site of photoconversion is provided for dendritic (G) and somatic (H) photoconversion 1 hr following ER release. Adapted from Bowen et al., (2017) and reprinted with permission from eLife.

