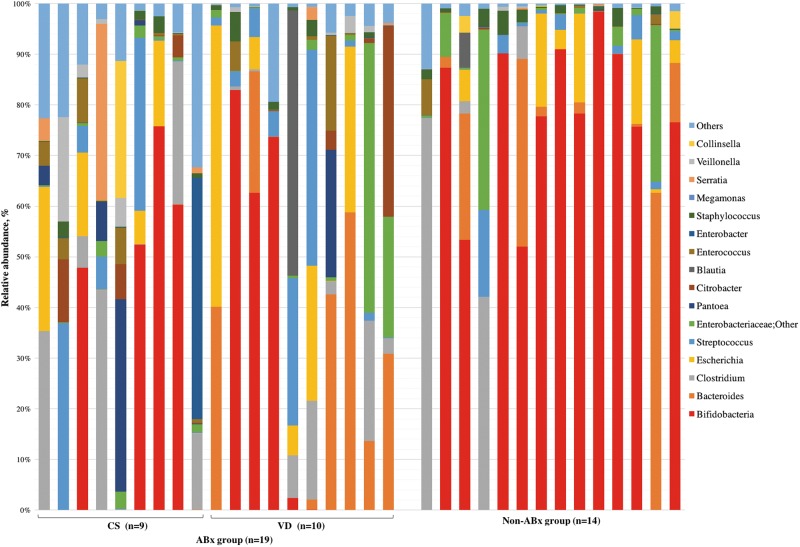
Fig. 3.
Representation of bacterial family relative abundance in the gut microbiota in 33 healthy infants (mean age 44 days). Each vertical bar represents an infant, segregated into two groups according to antimicrobial use at delivery. The ABx and Non-ABx groups include infants whose mothers did and did not receive antimicrobials at delivery, respectively. In the ABx group, CS indicates Cesarean section and VD indicates vaginal delivery. Bars are shown in the order of registration. The top 20 bacteria strains are shown and other strains are included in “others”. Bifidobacteria (indicated in red) were dominant in most infants

