Fig. 1.

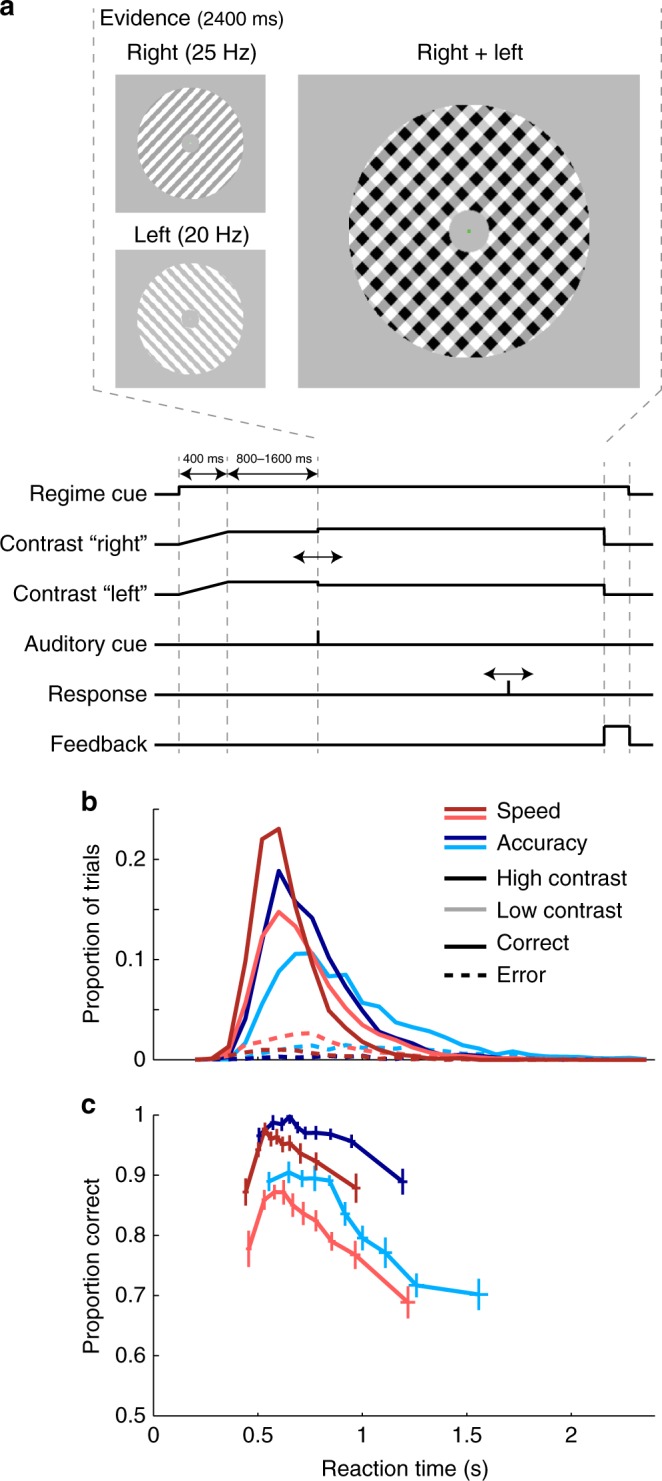
Task and Behavior—RT histograms and conditional accuracy functions. a Task structure and trial timing. Two overlaid grating patterns tilted 45 degrees to the left and right were phase-reversed at 20 Hz and 25 Hz, respectively. Both gratings initially had an equal contrast of 50% (Baseline), and after a variable delay one stepped to 56% (low contrast) or 62% (high contrast), while the other decreased by the same amount to 44% or 38%. In the example stimulus in a, the right-tilted pattern increased in contrast. This contrast-difference “evidence” was displayed for 2.4 s and evidence onset was marked by an auditory cue to avoid temporal ambiguity. b Reaction time distribution for correct (solid) and incorrect (dashed) response trials of high (darker lines) and low (lighter lines) Contrast differences in the Speed (red) and Accuracy (blue) regime. c Response accuracy computed as the proportion of correct responses in each of ten reaction time bins separately for each condition. Horizontal and vertical error bars denote the standard error of the mean RT and response accuracy across the 16 subjects. Apart from a low response accuracy for very fast responses, conditional accuracy functions of all conditions declined over RT
