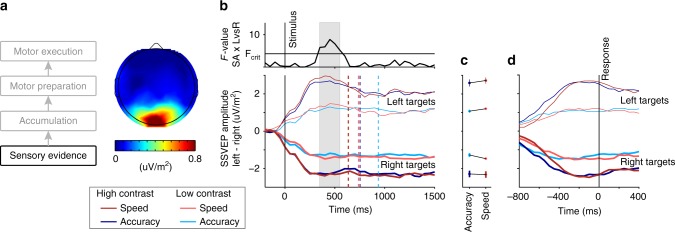
Fig. 2.
Sensory evidence modulations due to speed pressure. a Average steady-state visual evoked potential (SSVEP) measured in the 800 ms before stimulus onset was maximal at occipital electrodes around standard site Oz. b The difference in amplitude between the steady-state visual response to the left- and right-tilted gratings underwent clear changes in the direction of the Target Type (increased-contrast in the left/right-tilted grating, thin/thick lines), and this directional effect varied in strength as a function of high/low Contrast difference (dark/light shades), and Speed/Accuracy Regime (red/blue). Specifically, there was an increased separation between the stronger sensory representation of the increased-contrast and the weaker representation of the decreased-contrast grating under speed pressure. Upper panel shows the strength (F-value) of the Regime × Target Type interaction in a time-resolved fashion, illustrating the time frame during which the differential between left- and right-targets was significantly widened under speed pressure (shaded gray). Dashed vertical lines indicate mean RT of each condition. Note that the gradual initial increase/decrease in the differential SSVEP (−100 to about + 200 ms), despite the contrast change stepping instantaneously, is attributable to the fact that SSVEP amplitude at a given time is measured in a 400-ms window centered on that time, and this leads to the apparent deviation even before evidence onset. c Mean SSVEP amplitude in the a priori chosen time window between 250 and 450 ms after stimulus onset with error bars depicting the standard error of the mean across the 16 subjects. d Differential SSVEP amplitude plotted aligned to the response

