
Fig. 3.
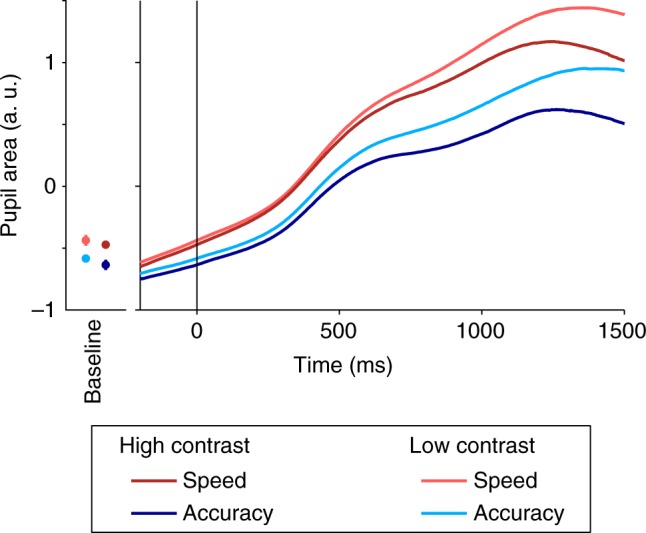
Pupil size is modulated by speed pressure. Traces depict mean pupil size plotted over time aligned to evidence onset. Traces are baseline-corrected with respect to the average pupil size in a −500 to 0 ms time window with respect to the onset of the regime-cue. Pupil size was increased under speed pressure (red traces) starting just before evidence onset. The left panel shows the mean pupil size at the onset of evidence presentation for all four conditions with error bars indicating S.E.M. across the 16 subjects. The effect of speed pressure increased in magnitude over the course of evidence presentation, visible in the increasing separation between red and blue traces