Fig. 2.
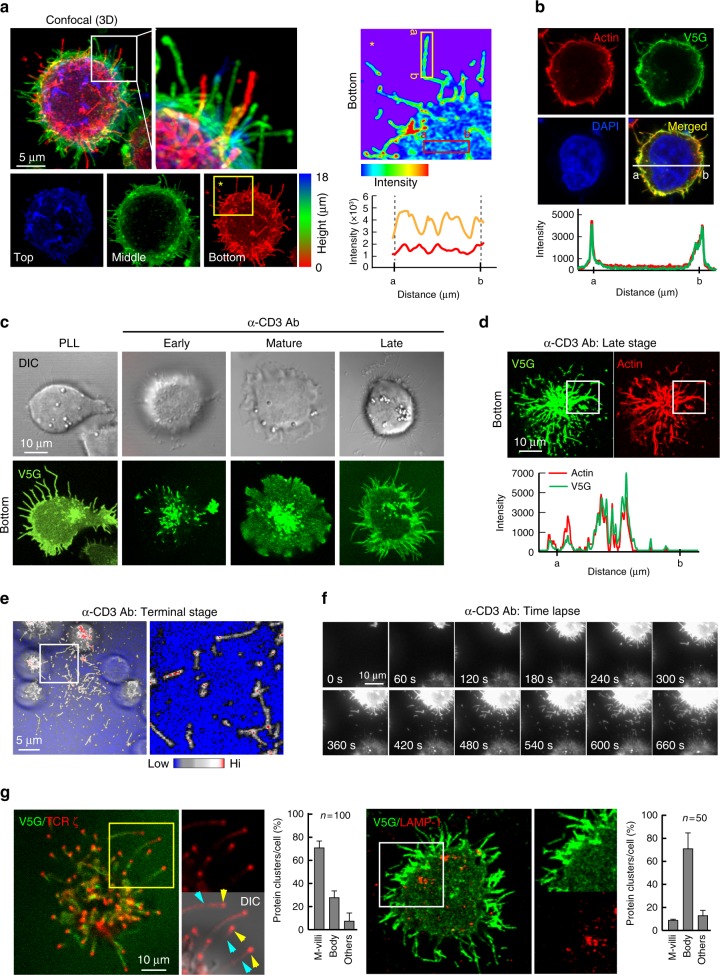
T cells generate V5G+ microvilli particles on anti-CD3-coated surfaces. a V5G+ Jurkat T cells were imaged by confocal microscopy and color-coded by z-position (left). Comparison of V5G fluorescence intensity between microvillus shaft and membrane surface (right). b Co-localization of V5G with F-actin. V5G+ Jurkat T cells on PLL were stained with TRITC-phalloidin. c Confocal images of V5G+ Jurkat T cells on anti-CD3-coated coverglass. Cells were monitored for 60 min, and representative images of each stage are shown. d Co-localization of V5G+ microvilli with F-actin. V5G+ Jurkat T cells on anti-CD3-coated coverglass and incubated for 20 min to 30 min were stained with TRITC-phalloidin. The fluorescence intensity profiles from a and b were analysed with ZEN v2.1 (for a, b, and d; Carl Zeiss). e Separated V5G+ microvilli particles are colored at the terminal stage. f Real-time V5G+ microvilli particles generation from activated T cells. V5G+ Jurkat T cells on anti-CD3-coated coverglass were observed by TIRFM (see also Supplementary Movie 1). g Jurkat T cells expressing V5G and TCRζ_ptdTomato were placed on anti-CD3-coated coverglass for 30 min. Protein localization at the terminal stage of T cell activation was determined. For LAMP-1 imaging, primary and secondary antibodies were used

