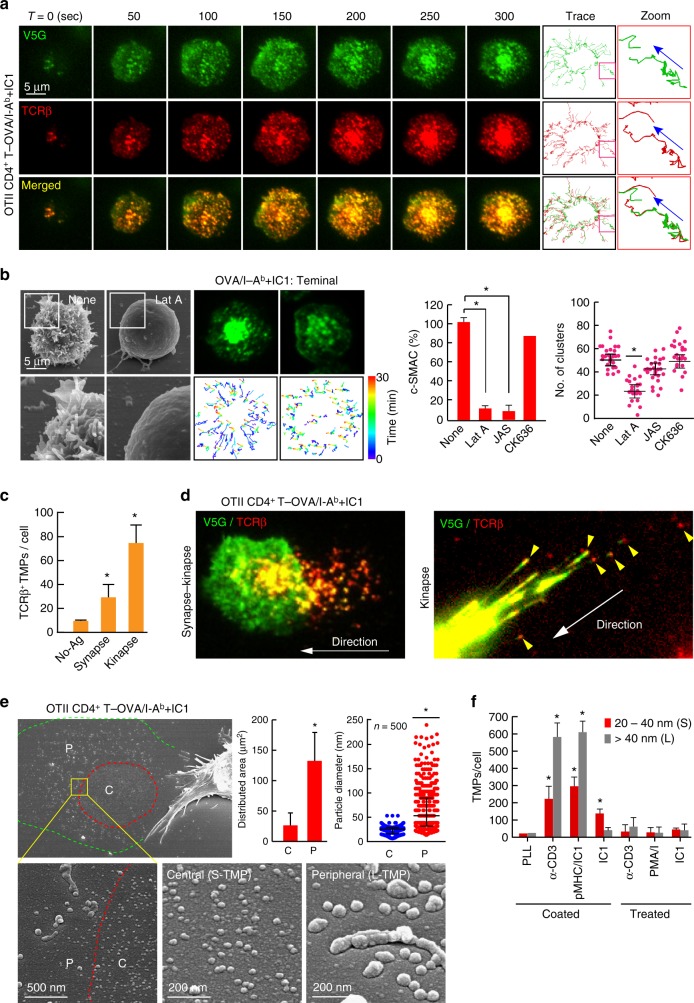
Fig. 3.
TCR-enriched microvillus particles are released to a greater extent during T cell kinapse mode. a Co-localization of V5G with TCR microclusters. V5G+ OTII CD4+ T cells were stained with anti-TCRβ (H57Fab-Alexa594) and examined on a planar bilayer presenting OVA peptide/I-Ab and ICAM-1 (see also Supplementary Movie 3). Relative time scales starting from the time of cell spreading are labeled on the images. Representative trajectory of individual TCR microclusters are shown in the right panel. b V5G+ OTII CD4+ T cells were pretreated for 30 min with (Lat A; 237 nM), JAS (100 nM), and CK636 (100 μM), followed by SEM (left) and TIRFM imaging to visualize V5G+ microvillus movement on the lipid bilayer (middle). Boxed regions are shown enlarged at the bottom of the panels. Representative trajectories of individual V5G clusters (bottom). Statistical analyses of the frequency of cSMAC formation and the number of V5G clusters in OTII CD4+ T cells (right). *P < 0.05 vs. none. Data represent the mean of three experiments ± SEM. c, d Release of TCR+ TMPs during synapse and kinapse. V5G+ OTII CD4+ T cells were stained with anti-TCRβ (H57Fab-Alexa594) and observed on a lipid bilayer presenting OVA peptide/I-Ab and ICAM-1 by TIRFM (see also Supplementary Movie 4). The numbers of TCRβ+ TMPs were quantitated using ImageJ software (c). *P < 0.01 vs. no antigen (No-Ag). Data represent the mean of three experiments ± SEM. e L- and S-TMP release during synapse and kinapse. Cells from (d; synapse–kinapse) were subjected to SEM analysis. P, pSMAC; C, cSMAC. Particle diameters were analysed using 500 particles in the C and P of a single cell, and > 30 cells were examined. Data represent the mean of three experiments ± SEM. *P < 0.001 vs. C. f TMP generation from OTII CD4+ T cells was examined in each condition. Cells were subjected to SEM, and the number of TMPs per cell was analysed using ImageJ software. Data represent the mean of three experiments ± SEM. *P < 0.001 vs. PLL

