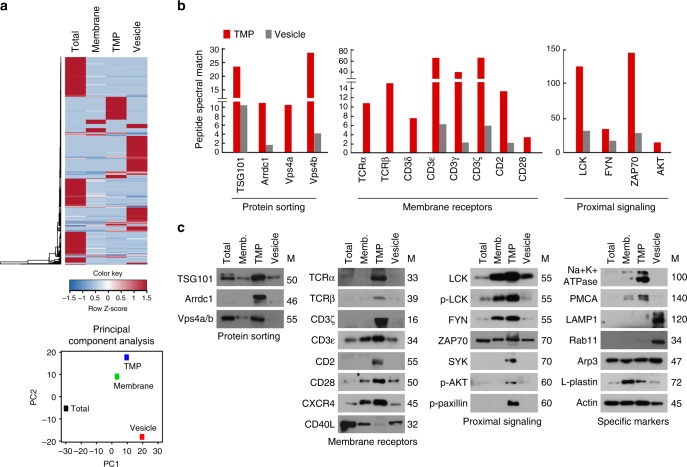
Fig. 6.
Identification of proteins in TMPs by LC-MS/MS. a Unsupervised clustering (upper) and PCA (bottom) of LC-MS/MS-based whole-proteome data from total, vesicle, membrane, and TMP groups. The heatmap represents relative expression patterns of proteins across the four groups, and hierarchical clustering of samples (column) and proteins (rows) was based on Pearson’s correlation coefficient used to measure the distance. b Comparison of PSMs between TMPs and vesicles. c Western blot analyses of total lysates, membrane, TMPs, and vesicles from mouse CD3+ T cells

