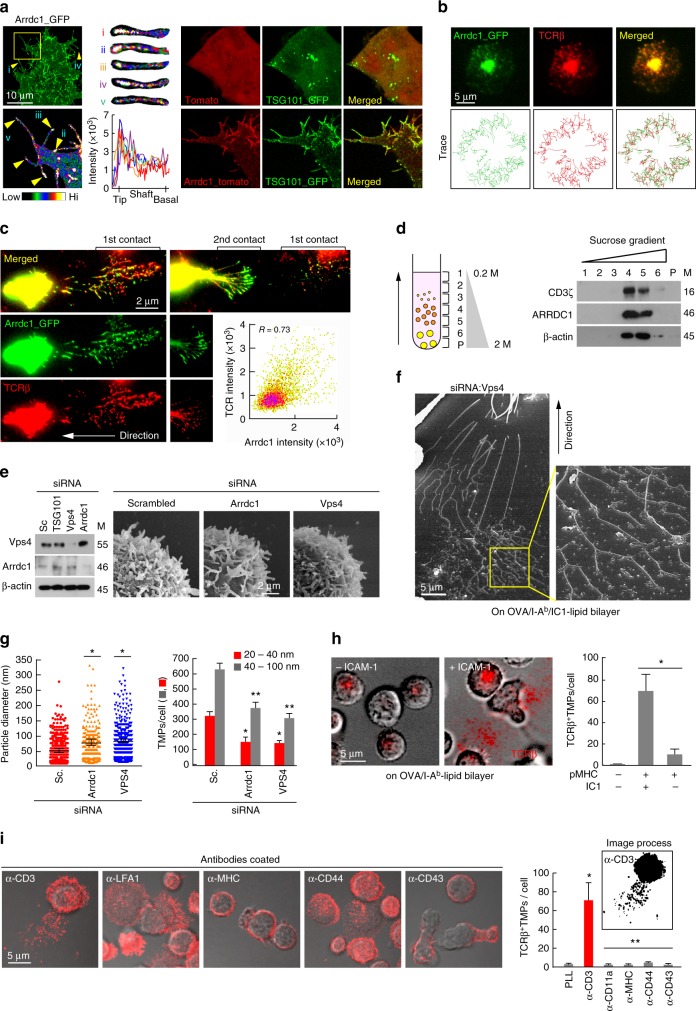
Fig. 7.
L-TMPs are further fragmented by membrane-budding complexes. a Localization of Arrdc1 and TSG101 in the microvillus tips of HEK293T cells. Arrdc1_GFP was represented with pseudo-color coding according to fluorescence intensity. Cropped images from selected microvilli (yellow arrows) are displayed from i to v (left). Recruitment of TSG101 to the membrane in Arrdc1-overexpressing cells (right). b Co-clustering of Arrdc1_GFP and TCRβ into the cSMAC. Arrdc1_GFP+ OTII CD4+ T cells were stained with anti-TCRβ (H57Fab-Alexa594) and examined as described in Fig. 3a. Images were selected at 300-s post-recording, and the representative trajectories are shown in the bottom panel. c Release of TCR+/Arrdc1_GFP+ TMPs during the synapse–kinapse transition stage. Arrdc1_GFP+ OTII CD4+ T cells were stained with anti-TCRβ and observed as described in Fig. 3d. d Purified TMPs were ultracentrifuged with a sucrose gradient and blotted with anti-Arrdc1, anti-CD3ζ, and anti-β-actin (lanes 1–6, sucrose fraction; P, pellet). e Knockdown of Vps4 and Arrdc1 by siRNA and confirmation of siRNA efficiency by western blot analysis. Surface analysis of CD4+ T cells by SEM after knockdown of the indicated proteins. f, g Representative SEM analysis of Vps4-deficient OTII CD4+ T cells on the lipid bilayer (f). Particle diameters and numbers of TMPs per cell were analysed by ImageJ software (g). Data represent the mean of three experiments ± SEM. *P < 0.05 vs. scrambled (Sc., left) or scrambled (20–40 nm, right) siRNA. **P < 0.001 vs. scrambled siRNA (40–100 nm). h TCR+ TMP release on an OVA peptide/I-Ab lipid bilayer with or without ICAM-1. The number of TCR+ TMPs per cell was analysed by ImageJ software. Data represent the mean of three experiments ± SEM. *P < 0.001 vs. pMHC/ICAM-1. i TCR+ TMP release on plates coated with various antibodies. Data represent the mean of three experiments ± SEM. *P < 0.001 vs. PLL

