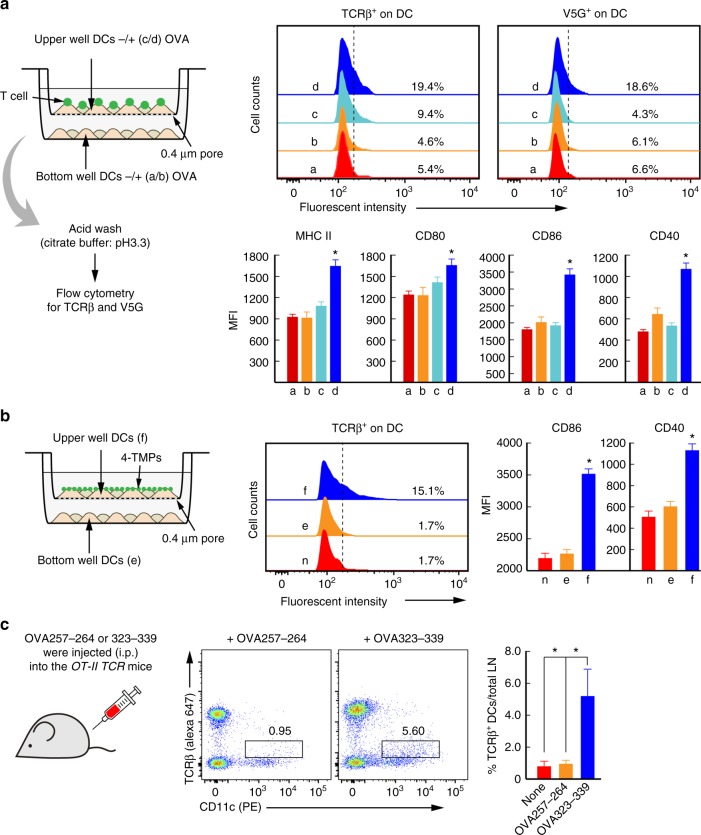
Fig. 9.
Physical interaction between TMPs and the DC surface is critical for TMP-mediated DC activation. a Schematic diagram of the transwell system (left). After co-incubation for 2 h, DCs were acid washed and evaluated for TCRβ and V5G transfer (upper panel), followed continued incubation for 24 h. The expression of MHC class II, CD80, CD86, and CD40 on DCs (CD11c+) was analysed by flow cytometry and expressed as histograms and mean fluorescence intensity (MFI). Data represent the mean of three experiments ± SEM. *P < 0.01 vs. c. b 4-TMPs from anti-CD3-coated surfaces were treated with DCs as depicted in the schematic diagram (left) and incubated as described in a. TCRβ, CD86, and CD40 presentation on DCs (CD11c+) was analysed as described in a. Data represent the mean of three experiments ± SEM. *P < 0.01 vs. c. c Transfer of TCRs to DCs in vivo. OTII TCR transgenic mice were administered OVA257-264 and OVA323-339 (100 μg; i.p.) in PBS, respectively. After 48 h, draining lymph nodes were taken and dissociated, and cells were treated by acid buffer and stained for the indicated surface markers. Boxed areas represent TCRβ expression on DCs. Data are represented by one of three independent experiments with similar results. *P < 0.01 vs. none or OVA257-264

