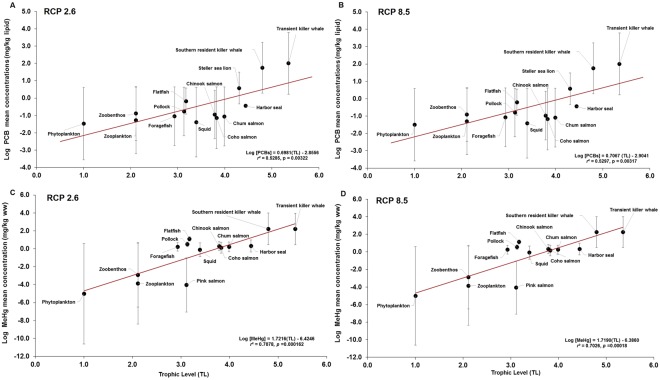
Figure 5.
Relationships between the logarithm (log10) of projected contaminant concentrations, simulated under RCP 2.6 and RCP 8.5 scenarios, and trophic level (TL) throughout the entire simulation period in the marine food web. (A) log PCBs vs TL under RCP 2.6; (B) log PCBs vs TL under RCP 8.5; (C) log MeHg vs TL under RCP 2.6; and, (D) log MeHg vs TL under RCP 8.5. Data points (solid circles) represent the overall log average ± log SD (error bars) concentrations calculated for the entire simulation period (2005–2100). For reference purposes, PCB data predicted for harbor seals (Phoca vitulina), Steller sea lions (Eumetopias jubatus), and transient killer whales (O. orca) are also included as reference data points. The apparent trophic magnification factor (TMF) was calculated from the slopes of the relationships (see Table S6 in Supplementary Information).

