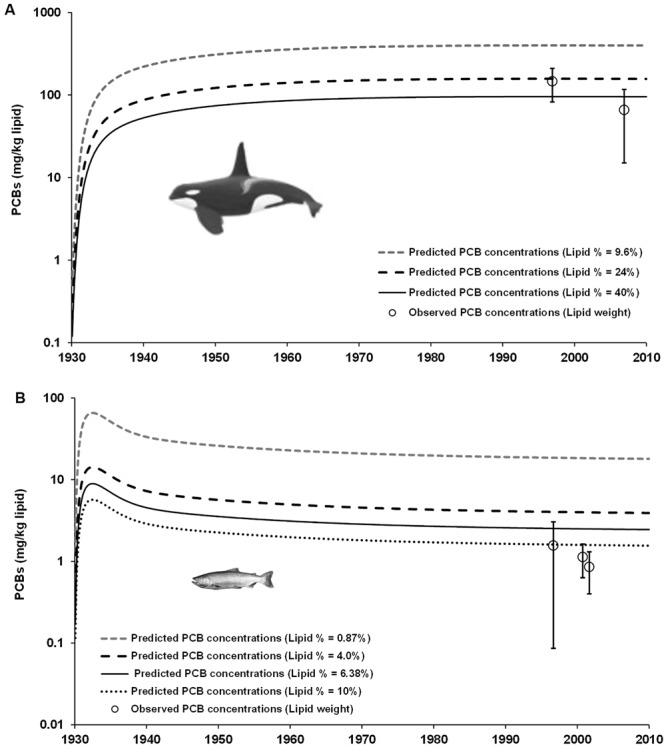
Figure 6.

Historical projections of PCB concentrations (mg/kg lipid) in southern resident killer whales (SRKW) (A) and Chinook salmon (B) simulated with the Ecotracer routine of the EwE model and adjusted to different values of lipid content (%). Projected PCB concentrations of PCBs lipid normalized to relatively normal values of lipid content reproduce concentrations close to empirical data observed in both species, as reported elsewhere18–21. The open circles are the average PCB concentration observed in SRKW and Chinook salmon and error bars are 95% CI. By normalizing the PCB concentrations to low lipid fractions observed in killer whales (i.e. lipid content = 9.6%) and Chinook salmons (i.e. lipid content = 0.87%), the concentrations of PCBs are amplified in these species as an indication of a bioamplification process.
