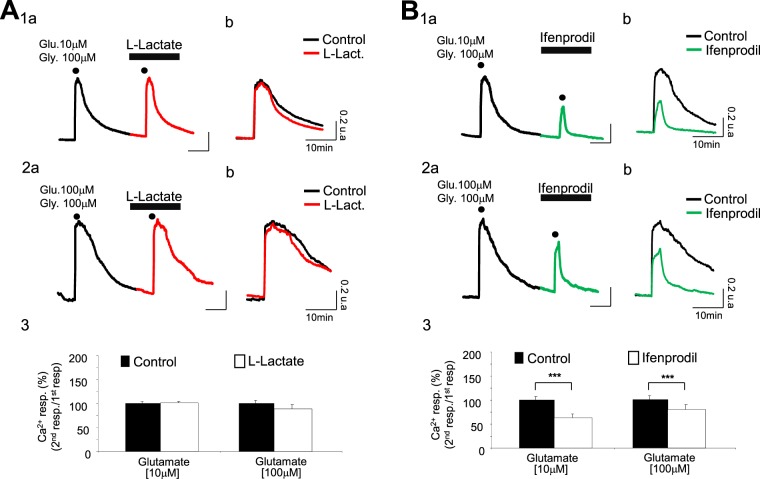
Figure 5.
The L-Lactate-induced potentiation is blunted at increased glutamate concentration; activation of a NR2B component in the calcium response appears. (A1a and A2a) Intracellular Ca2+ signals (black– and red-average Fura-2 ratio traces respectively for control condition and in presence of L-Lactate at 10 mM) recorded from 2 different cultures (A1a: ncell = 54; A2a: ncell = 29) and following 2 successive co-applications of glutamate/glycine (A1a: 10 μM/100 μM; A2a: 100 μM/100 μM; 2 min; dots). (A1b and A2b) Expanded calcium traces shown in A1a and A2a. In contrast to the Ca2+ response evoked by a weak glutamate concentration (Fig. 2), L-Lactate is inefficient at potentiating the Ca2+ response evoked by a strong concentration of glutamate. (A3) Bar charts summarizing the absence of potentiation by L-Lactate of Ca2+ responses evoked by the co-application of glutamate/glycine when concentration of glutamate is 10 μM (ncult = 6; ncells = 276) or 100 μM (ncult = 6; ncells = 155). (B1a and B2a) Intracellular Ca2+ signals (black– and green-average Fura-2 ratio traces respectively for control condition and in presence of Ifenprodil at 2 μM) recorded from 2 different cultures (B1a: ncell = 31; B2a: ncell = 27) and following 2 successive co-applications of glutamate/glycine (B1a: 10 μM/100 μM; B2a: 100 μM/100 μM; 2 min; dots). (B1b and B2b) Expanded calcium traces shown in B1a and B1b. They clearly indicate a strong decrease of the Ca2+ response evoked by the co-application of glutamate/glycine in presence of Ifenprodil. (B3) Bar charts summarizing the significant blocking effect of Ifenprodil on Ca2+ responses evoked by the co-application of glutamate/glycine when concentration of glutamate is 10 μM (ncult = 6; ncells = 187) or 100 μM (ncult = 6; ncells = 138). Results are presented as means ± SEM (***p < 0.001; paired t-test).

