Fig. 3.
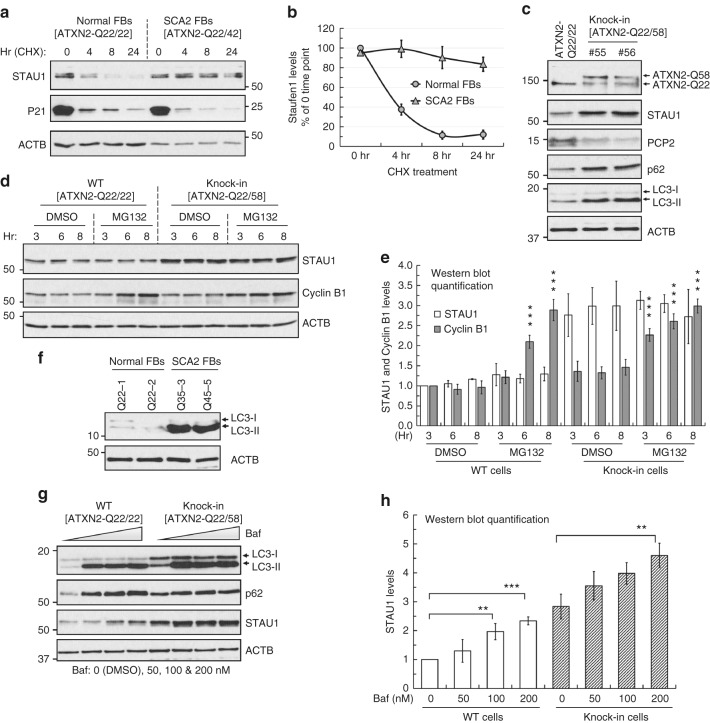
Increased STAU1 abundance caused by abnormal autophagy. a, b Stability of STAU1 in SCA2 FBs. Normal and SCA2 FBs were exposed to CHX (25 µg/ml) for different times from 0 to 24 h, and protein extracts were immunoblotted for STAU1. STAU1 levels are quantified as a percentage of the value for the 0 time point and p21 protein levels are shown to verify CHX inhibition. STAU1 protein stability was prolonged in SCA2 FBs compared to normal FBs. b Quantification of STAU1 on western blots is shown. c ATXN2-Q22/58 KI cells show increased STAU1, p62 and LC3-II levels on western blots. PCP2 level is decreased in this cell model. d, e STAU1 is not degraded by the proteasome pathway. d HEK-293 and ATXN2-Q22/58 KI cells were treated with proteasome inhibitor MG132 (10 µM) or DMSO as control at different time points and cell extracts were analyzed by western blotting. HEK-293 and ATXN2-Q22/58 KI cells show insignificant changes in STAU1 levels compared to controls upon proteasome inhibition. Increased Cyclin B1 protein levels indicate successful proteasome pathway inhibition. e Quantification of STAU1 and Cyclin B1 on western blots. Two-way ANOVA followed by Tukey’s multiple comparison test. Data are mean ± SD, ns = P > 0.05, ***P < 0.001: DMSO vs. MG132 treated groups (6 and 8 h for HEK-293 cells, and each time points for ATXN2-Q22/58 KI cells). f–h Inefficient autophagy in the presence of mutant ATXN2. f SCA2 FBs show inefficient autophagosome-lysosome fusion as indicated by increased LC3-II levels on western blots. g, h Bafilomycin A1 (Baf) lowers STAU1 clearance through inefficient autophagosome-lysosome fusion. g HEK-293 and ATXN2-Q22/58 KI cells were treated dose-wise with Baf for 6 h and analyzed by western blotting. Baf treatment showing dose-wise increased levels of LC3-II and p62 levels and significant increases in STAU1 levels for both cell types compared to untreated cells. h Quantification of STAU1 on western blots. One-way ANOVA followed by Tukey’s multiple comparison test. Data are mean ± SD, ns = P > 0.05, **P < 0.01, ***P < 0.001. β-Actin was used as loading control. Representative blots of three independent experiments are shown

