Fig. 3.
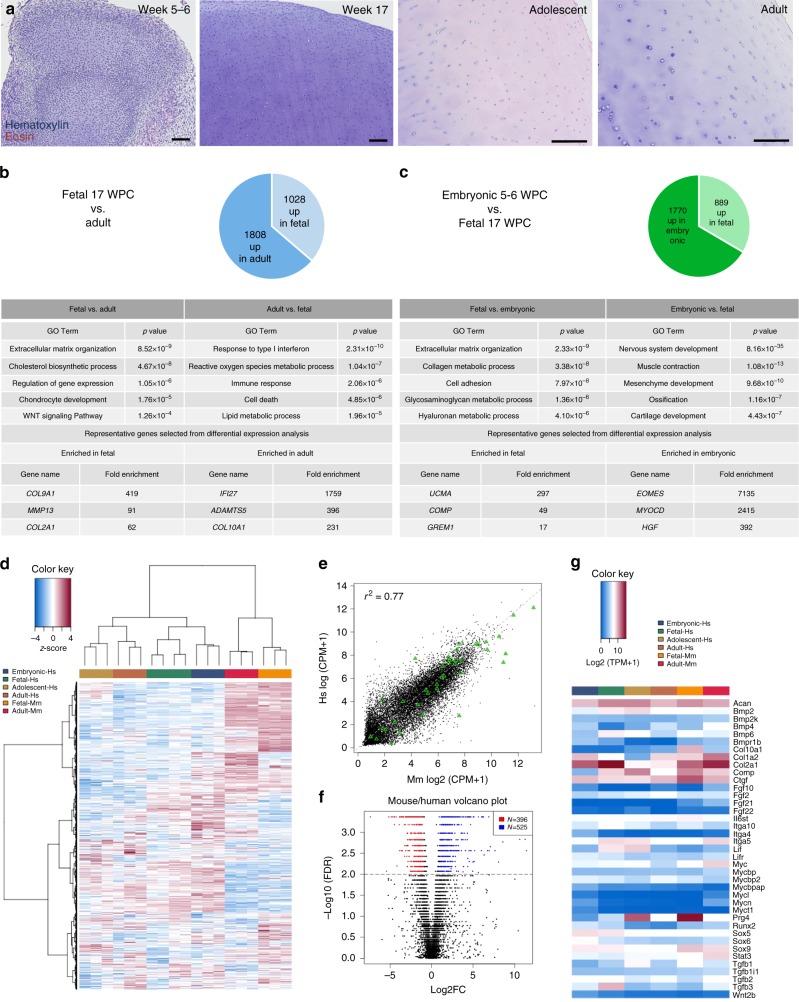
Transcriptional differences across human and mouse cartilage development. a Hematoxylin and Eosin (H&E) staining showing tissue architecture of chondrocytes at each stage profiled. b Selected Gene Ontology (GO) terms and genes enriched between fetal 17 WPC (weeks post conception; left) or adult (right) chondrocytes. c Selected GO terms and genes enriched between fetal 17 WPC (left) or embryonic 5–6 WPC (right) chondrocytes. d Hierarchical clustering of 15,000 genes expressed across 4 stages of human ontogeny and 2 stages of mouse development. e Mean enrichment plot between mouse and human samples. Green triangles represent selected chondrogenic genes. f Volcano plot showing differentially expressed genes between mouse and human. g Heat map (logarithmic expression) of chondrogenic genes shown in mean enrichment plot across all human and mouse samples. Hs: human, Mm: mouse, FC: fold change. N = 3–4; scale bars = 50 μm

