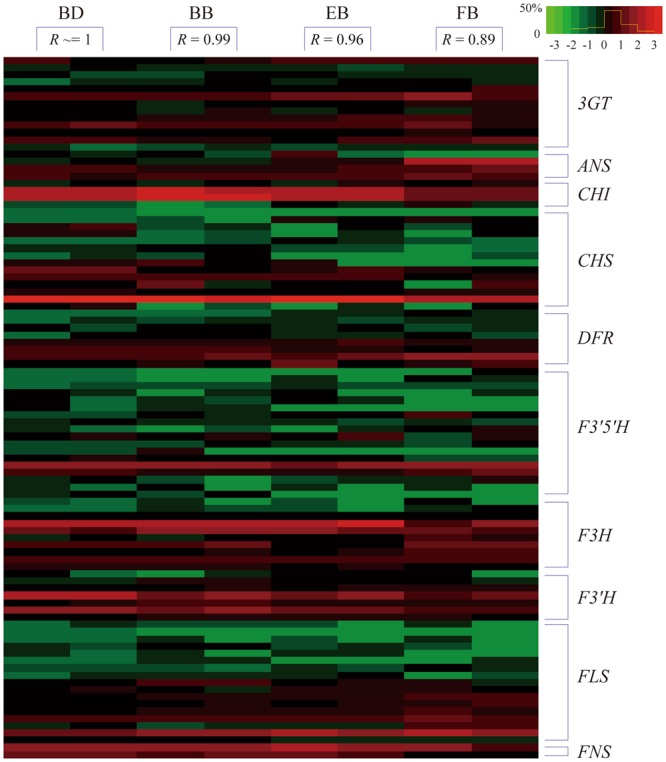
Figure 7.

Heatmap of the expression levels of structural unigenes related to flavonoid biosynthesis in the budding (BD), bud breaking (BB), early blooming (EB) and full blooming (FB) stages. Repeated measures were taken for each stage and the pearson correlation coefficient (R) is calculated between each replicate. The color scale indicates a relative fold-change in gene expression, where red indicates high expression and green indicates low expression. The yellow line within the color scale indicates the percent of unigenes with different interval values.
