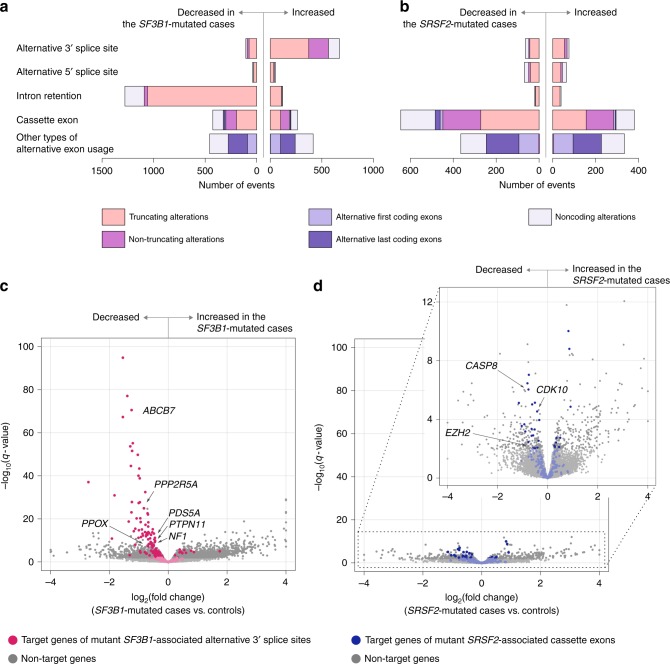
Fig. 3.
Transcriptional consequences of splicing alterations. a, b Types and numbers of splicing alterations significantly associated with SF3B1 (a) and SRSF2 mutations (b). Bars in the right indicate alternative splicing events that were more frequently found in SF-mutated cases. Bars in the left are those that were more frequently found in the controls. Colors indicate consequences of splicing alterations at the transcript level. c, d Volcano plots comparing expression levels of the authentic transcripts between the SF3B1- (c) and SRSF2-mutated CD34+ cells (d) and those without known SF mutations. The number of samples in each group is shown in Fig. 1c. X-axis indicates fold changes in gene expression on a log2 scale. Y-axis indicates q-values on a negative log10 scale. Target genes of mutant SF3B1-associated alternative 3′ splice sites are depicted in red (c). Those of mutant SRSF2-associated cassette exons are depicted in blue (d)

