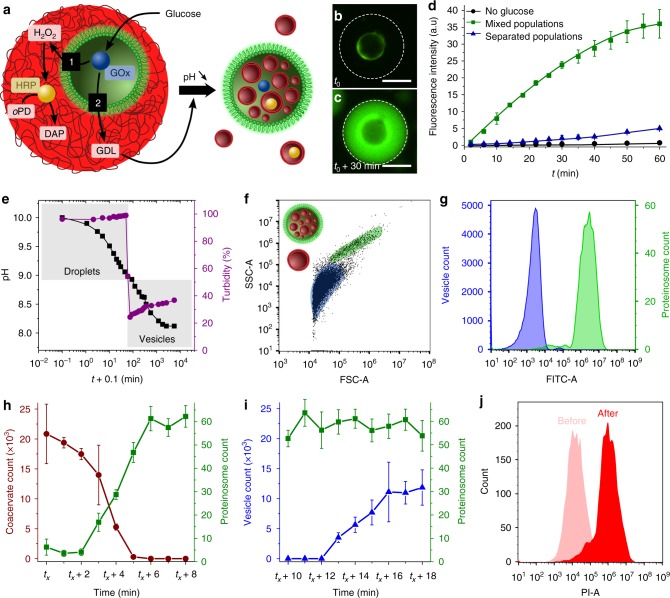
Fig. 2.
Synergistic and antagonistic behaviour in synthetic host–guest protocells. a Graphic showing FITC-labelled proteinosome (green) containing GOx (blue circle) internalised by a single pH-responsive fatty acid micelle coacervate droplet (red) loaded with horseradish peroxidase (HRP, yellow circle) to form a nested proteinosome-in-coacervate structure capable of synergistic (path 1) or antagonistic (path 2) chemical coupling. oPD ortho-phenylenediamine; DAP 2,3-diaminophenazine; GDL glucono-δ-lactone. b, c Fluorescence microscopy images showing a single proteinosome-in-coacervate protocell immediately after addition of glucose (1 mM, t0) (b), and after 30 min reaction time (c). d Time-dependent changes in fluorescence intensity associated with the formation of DAP in host–guest protocells produced as described in a (green squares), or in spatially separated protocell populations in the presence (blue triangles) or absence (control; black dots) of 1 mM glucose (see Methods). Error bars represent the standard deviation of the fluorescence intensity (n = 3). e Time-dependent plot showing gradual decrease in pH (black squares) and associated rapid decrease in turbidity (purple circles) due to vesicle formation at pH 8.9 for a population of GOx-containing proteinosome-in-micelle coacervate protocells (number density ratio = 1:12) incubated in glucose (t = 0, 10 mM). f FACS-derived 2D dot plots recorded 120 min after addition of glucose (10 mM) to a suspension of FITC-labelled GOx-containing proteinosome-in-coacervate host–guest protocells (number density ratio = 1:12) showing coexistence of a binary population of free myristic acid vesicles (blue domain) and proteinosomes containing fatty acid vesicles (green domain). FSC forward-scattered light; SSC side-scattered light. g Histograms of green fluorescence signals (FITC-A) recorded 120 min after addition of 10 mM glucose to FITC-labelled GOx-containing proteinosome-in-coacervate protocells; plots for unlabelled myristic acid vesicles dispersed in the bulk phase (blue, low fluorescence) and proteinosomes containing fatty acid vesicles (green, high fluorescence) are shown. h Plots showing population dynamics associated with the disassembly of GOx-containing FITC-labelled proteinosome-in-micelle coacervate droplets (red, number ratio = 1:12) and release of the entrapped proteinosomes (green). Counts were determined from the FACS-derived 2D dot plots, averaged every 5 s, and the standard deviation calculated accordingly. i Plots as derived in h but recorded over a period of 10 min and beginning from tx + 10 min showing constant and increasing vesicle-in-proteinosome (green) and free vesicle (blue) populations, respectively. j FACS-derived red fluorescence intensity (PI-A) histograms determined from proteinosome-gated 2D dot plots recorded on a single GOx-containing, non-labelled proteinosome population before mixing with Nile Red-stained micelle coacervate droplets, and 120 min after addition of 10 mM glucose to a dispersion of GOx-containing proteinosome-in-coacervate protocells

