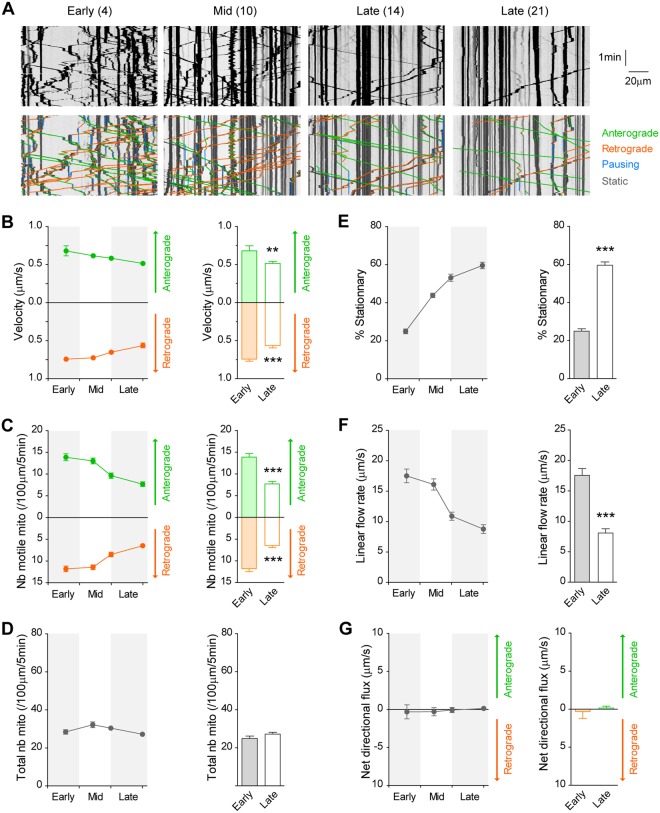
Figure 7.
Progressive reduction in axonal transport of mitochondria during network maturation. (A) Kymograph analyses at early, mid and late stages of network maturation show a progressive decrease in mitochondria motility. Number in brackets indicates DIV. Anterograde and retrograde movements, pauses and stationary mitochondria are shown. (B) Decreased segmental velocity (Antero, F3,225 = 3.1, p < 0.05; Retro, F3,225 = 10.0, p < 0.0001; n = 57) and (C) decreased number of motile mitochondria (Antero, F3,225 = 15.9, p < 0.0001; Retro, F3,225 = 18.9, p < 0.0001). (D) The total number of mitochondria remains constant over time. (E) Increased percentage of stationary mitochondria (F3,225 = 98.9, p < 0.0001). (F) Decreased velocity and number of mitochondria lead to a global decrease in linear flow rate (F3,225 = 25.7, p < 0.0001) until DIV 14 (DIV 14 vs DIV 21, n.s) but (G) no directional preference could be observed. All bar graphs recapitulate data obtained at early (DIV 4) and late (DIV 21) stages of neuronal culture. ***p < 0.01, ***p < 0.0001.

