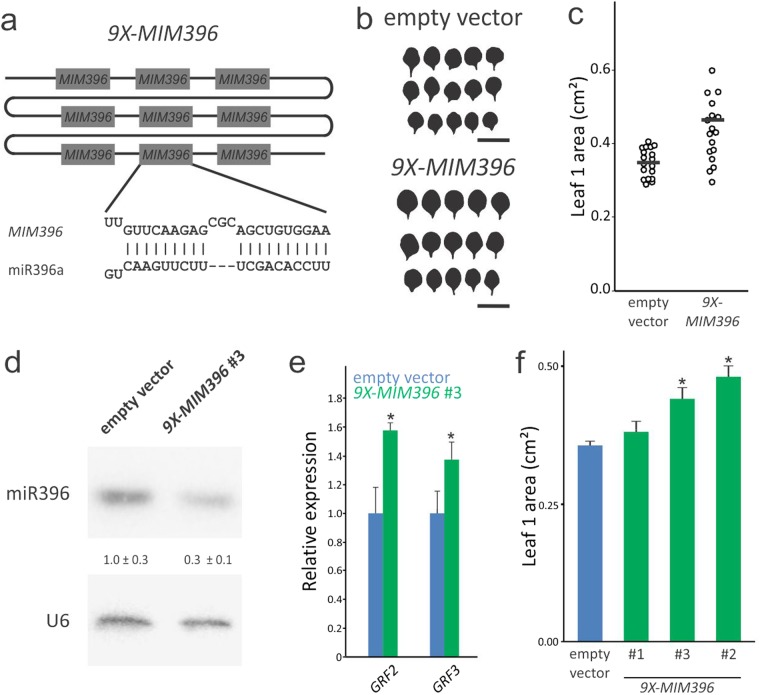
Figure 2.
miR396 limits leaf size in Arabidopsis. (a) Scheme of the multi-miR396 target mimic (9X-MIM396) prepared against miR396. (b,c) Fully expanded leaf 1 size distribution in a population of Arabidopsis primary transgenic plants transformed with the empty vector or with the 9X-MIM396 construct. In panel b, each silhouette of leaf 1 belongs to an independent primary transgenic plant transformed with the indicated vector. In the scatterplots in panel c, each circle indicates the size of a single leaf, while the horizontal solid bar represents the sample median. Bar = 1 cm. (d) Expression levels of miR396 in control plants transformed with the empty vector and 9X-MIM396 #3 plants. The miR396 levels were estimated by small RNA blots and the abundance relative to control plants is indicated by numerals. The data shown are mean ± SEM of three biological replicates. A probe against U6 snRNA was used as a loading and blotting control. The blot shown in the figure is a representative pair of samples from control and 9X-MIM396 #3 plants. (e) Expression levels of GRF2 and GRF3 in control plants transformed with the empty vector and 9X-MIM396 #3 plants. The GRF levels were estimated by RT-qPCR and normalized to control plants. The data shown are mean ± SEM of three biological replicates. Asterisks indicate significant differences from the control plants as determined by Student’s t-test (P < 0.05). (f) Leaf 1 size in control (empty vector) and three independent T3 homozygous transgenic lines transformed with 9X-MIM396.

