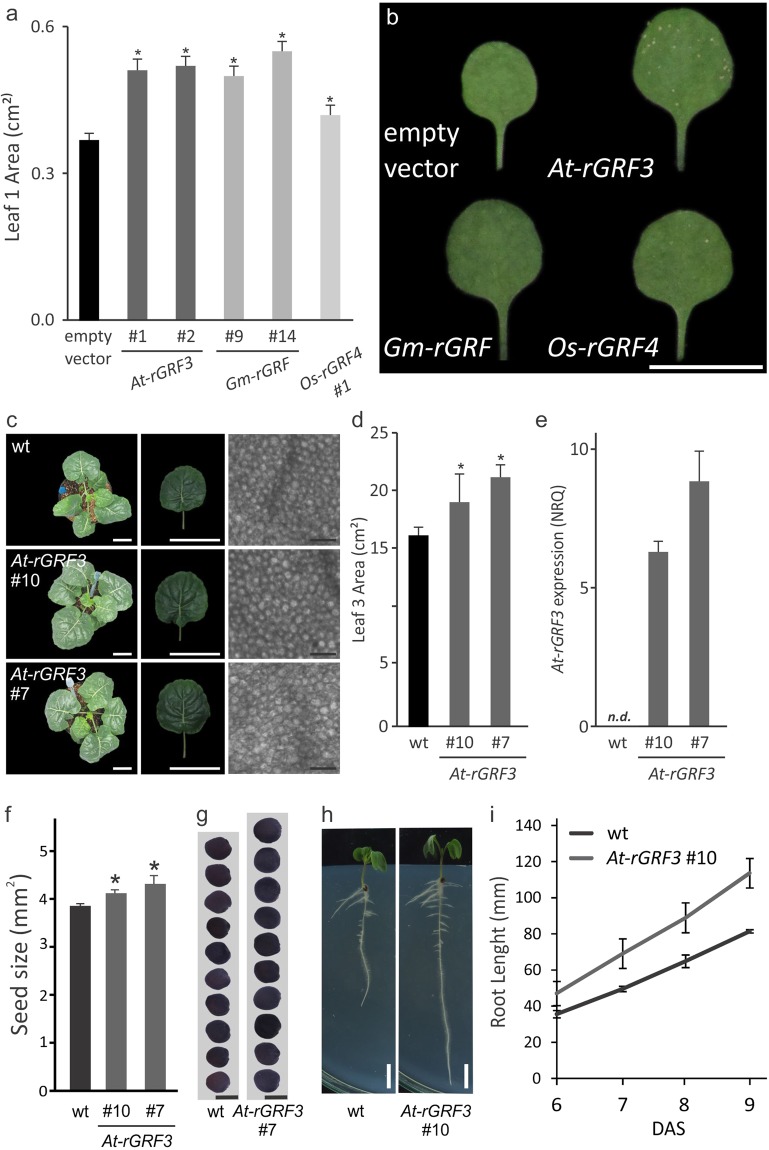
Figure 4.
rGRF3-like genes increase organ size in heterologous species. (a) Area of fully expanded leaf 1 of transgenic Arabidopsis plants expressing At-rGRF3 or selected orthologues from soybean (Gm-rGRF) or rice (Os-rGRF4). The data shown are mean ± SEM of 20 biological replicates. Asterisks indicate significant differences from plants transformed with the empty vector as determined by Student’s t-test (p < 0.05). (b) Leaf 1 of transgenic plants expressing At-rGRF3 or the corresponding orthologues from soybean (Gm-rGRF) or rice (Os-rGRF4). Bar = 1 cm. (c) Wild-type and transgenic Brassica oleracea plants expressing At-rGRF3. To the left, 4 week-old whole plants, in the middle, fully expanded leaf 3 and to the right, a paredermal view of palisade cells from fully expanded leaf 3. White bars = 5 cm; Black bars = 0.05 mm. (d) Size of leaf 3 of 4 week-old wt and rGRF3 transgenic B. oleracea plants. The data shown are mean ± SEM of 10 biological replicates. Asterisks indicate significant differences from the wt as determined by Student’s t-test (P < 0.05). (e) Expression of rGRF3 in B. oleracea transgenic plants as estimated by RT-qPCR. Data are mean ± SEM of 3 biological replicates. (f,g) Seed size of wt and rGRF3 #10 and #7 B. oleracea plants. The data shown in f are mean ± SEM of 30 biological replicates. Asterisks indicate significant differences from the wt control plants as determined by Student’s t-test (P < 0.05). Bar = 2 mm. (h,i) Root architecture (h) and root growth (i) of B. oleracea plants expressing rGRF3. The data shown are mean ± SEM of 6 biological replicates. Asterisks indicate significant differences from wt control plants as determined by Student’s t-test (P < 0.05). Bars = 1 cm.

