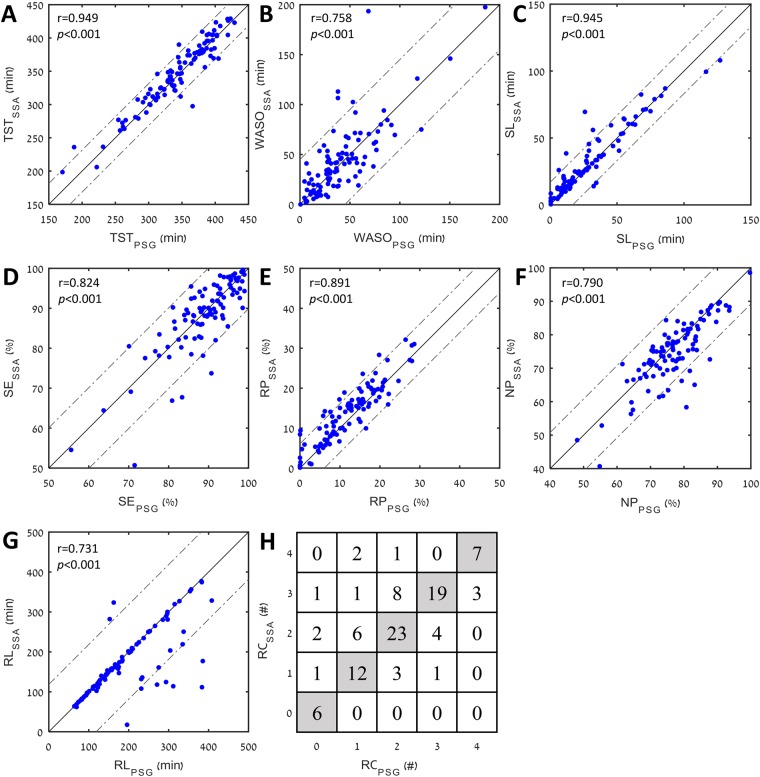
Figure 2.
Comparison of sleep quality parameters between SSA and PSG. Data was taken from the validation dataset (n = 100), each point represents a subject. (A) TST – Total sleep time (minutes); (B) WASO – Wake after sleep onset (minutes); (C) SL – Sleep latency (minutes); (D) SE – Sleep efficiency (percentage of total sleep time); (E) RP – Rapid-eye-movement sleep (percentage of total sleep time); (F) NP – Non-rapid eye movement sleep (percentage of total sleep time); (G) RL – rapid eye movement latency (minutes); (H) RC – number (#) of rapid eye movement cycles, presented as confusion matrix. Solid line – line of identity between polysomnography (PSG) and sleep sound analysis (SSA); dashed lines – 95% confidence interval; r – concordance correlation coefficient.

