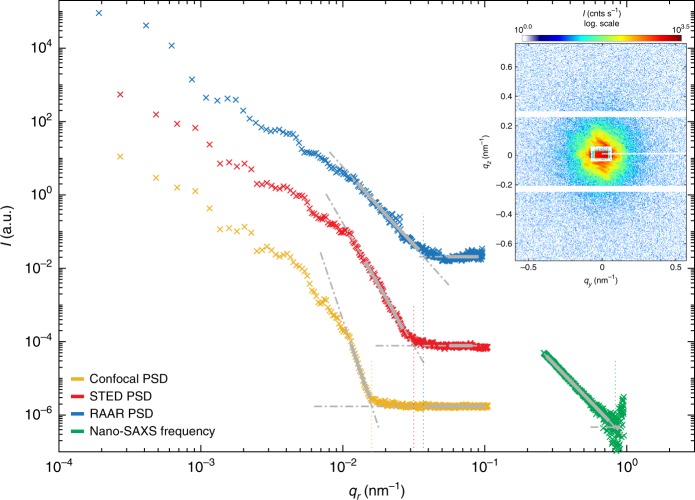
Fig. 4.
Power spectral densities (PSDs) of the confocal (yellow) and STED micrograph (red), the phase reconstructed image of the X-ray holography experiment (blue), along with the SAXS structure factor (power-law decay), all shown as a function of the scattering vector qr. For a direct comparison, all PSD values are transformed into a q-equivalent by rescaling the x-axis with a factor of 2π. The cross-over to the noise floor is determined to qi = 0.016, 0.032, 0.037, and 0.83 nm−1, for confocal, STED, holography and scanning SAXS data, respectively. Intensity values are shifted for clarity. The inset shows a typical diffraction pattern recorded in the nucleic region

