Figure 3.
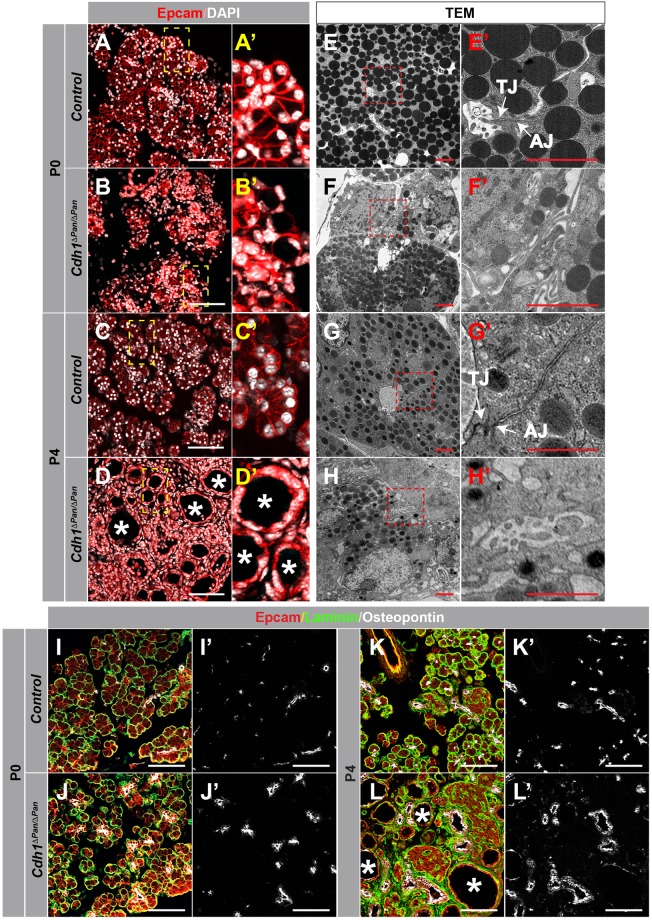
Impairment of adherens junctions and disrupted exocrine tissue integrity in Cdh1ΔPan/ΔPan pancreata. (A–D) Immunofluorescence analysis of Epcam (red) and DAPI (white) in control (A,C) and Cdh1ΔPan/ΔPan (B,D) pancreata at P0 and P4. Higher magnification views of yellow inset boxes are shown to the right in (A’,B’,C’,D’). (E–H) Transmission electron micrographs from control (E,G) and Cdh1ΔPan/ΔPan (F,H) pancreata at P0 and P4. Higher magnification views of red inset boxes are shown to the right in (E’–H’). White arrows point to tight junctions (TJs) and adherens junctions (AJs) as indicated. (I–L) Immunofluorescence analysis of Epcam (red), Laminin (green), and Osteopontin (white) in the pancreas of control (I,K) or Cdh1ΔPan/ΔPan (J,L) mice at P0 and P4. White asterisks indicate dilated/cystic exocrine structures. White scale bars = 100 μm. Red scale bars = 2 μm.

