Fig. 1.
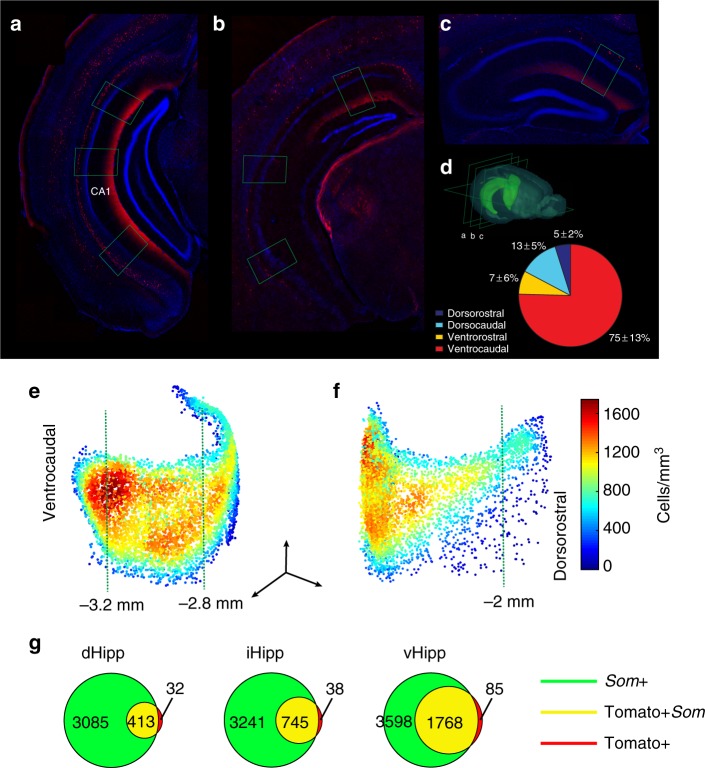
OLMα2 cells display a gradient-like distribution along the dorsoventral axis. a–c Coronal sections displaying Chrna2+ cell expression in the ventrocaudal, intermediate, and dorsorostral hippocampus, respectively. Green rectangles represent the position of cell counting in the respective slices. d Chrna2+ cell quantification per hippocampal division (n = 3). e, f Averaged density plot (n = 3, data obtained using the CLARITY method, see Online Methods) showing the distribution of OLMα2 cells from the caudal (e) and rostral (f) view (scale bars; x and z: 1 mm, y: 0.5 mm). Green punctuated lines represent relative distance from bregma. g Venn diagram illustrating the colocalization of somatostatin and tdTomato in Chrna2/tdTomato mice obtained using the CLARITY method (Supplementary Movie 1). The vast majority of Chrna2+ cells were Som+ along the dorsoventral axis

