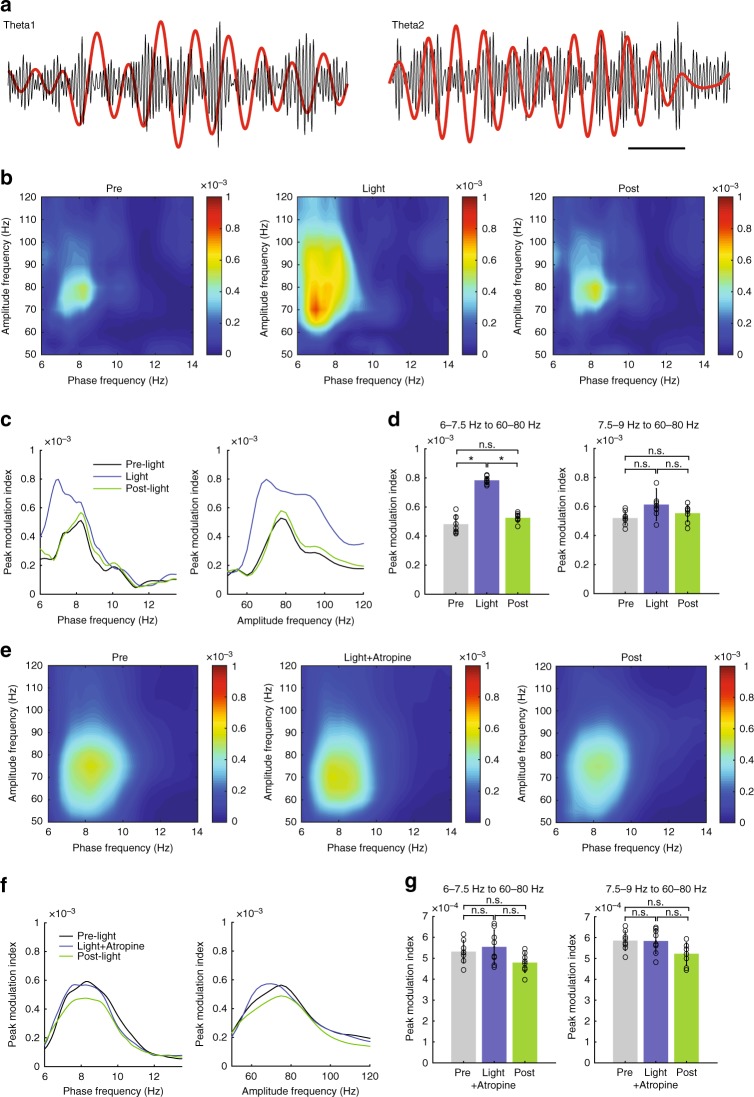
Fig. 6.
Theta2 modulates 60–80 Hz gamma activity in the vHipp stratum radiatum. a Examples of LFP traces (normalized by their maxima) filtered at theta1 (before light) and theta2 (during light) and gamma (bandpass 50–100 Hz). Scale bar: 250 ms. b Representative comodulograms showing theta–gamma phase–amplitude coupling measured before, during, and after OLMα2 cell stimulation while animals were running on a treadmill at 10 cm/s. No difference in gamma band power before and during light stimulation was found (data not shown). c Peak comodulation frequencies for theta and gamma oscillations. 7.5–9 Hz (theta1) couples to gamma before and after light stimulation. The arrow points to the modulation shifts to ~7 Hz during light (equivalent to the power peak induced by OLMα2 cell stimulation shown in Fig. 4b), while modulated gamma increases especially for ~70 Hz. d Group statistics show that theta modulation of gamma increased for 6–7.5 Hz (theta2) (n = 8, *p < 0.0001, repeated-measures ANOVA), whereas no difference for theta1 was observed (n = 8, n.s. = not significant). e–g Atropine prevented theta2–gamma comodulation, leaving theta1–gamma comodulation unaffected. Error bars in all bar graphs represent SEM

