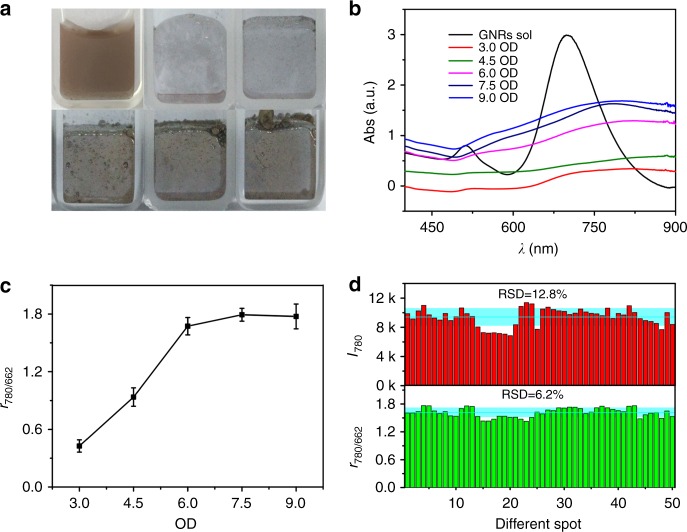
Fig. 7.
Effect of GNR concentrations on SERS performance. a Optical images of as-synthesized GNR sols and metal liquid-like GNR arrays on O-in-W interface fabricated by 1 mL of GNR sols with variable OD values: 3.0, 4.5, 6.0, 7.5, and 9.0, respectively. b The corresponding UV–Vis absorbance spectra, c relative SERS strength, r780/662, collected on interfacial GNR arrays, and d statistical histograms of r780/662 and I780, respectively. The error bars represent the statistical RSD and were calculated from triplicate SERS experiments

