
Fig. 2.
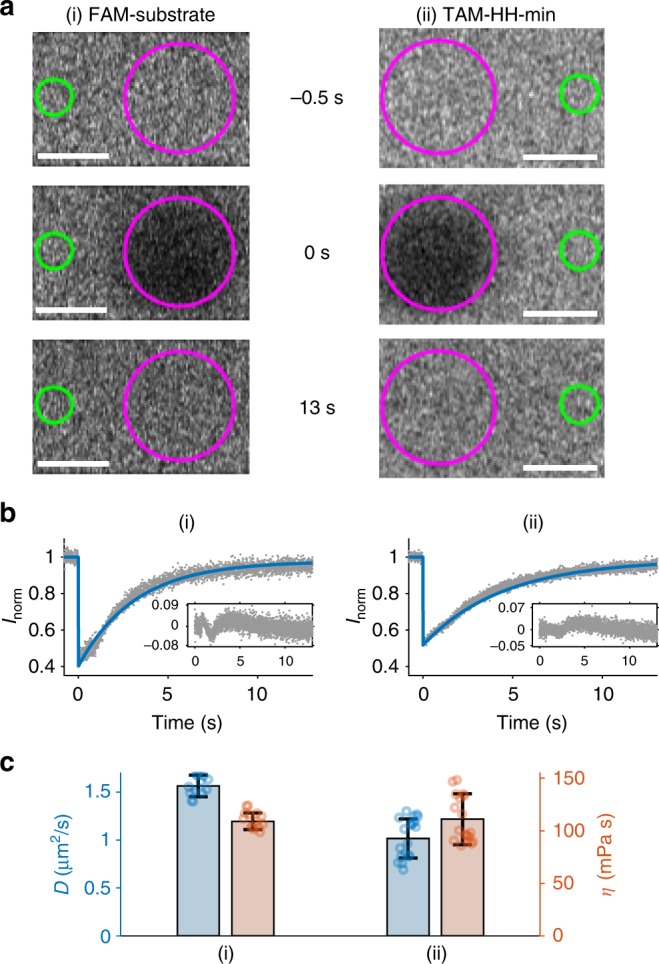
FRAP of bulk coacervate phase. Bulk coacervate phase (CM-Dex:PLys (4:1 final molar ratio) containing either (i) 0.36 μM FAM-substrate or (ii) 0.36 μM TAM-HH-min. a Output frames from confocal imaging (63×) are shown at t = −0.5 s before bleaching, directly after bleaching (magenta circle, t = 0 s) and t = 13 s after bleaching. The fluorescence intensity was normalised against a reference (green circle) and fit to standard equations. Scale bars are 5 μM. b Plots of normalised FRAP data for HH-min (ii) and FAM-substrate (ii) show the standard deviation (grey, N = 10) and fit (blue) from the same bleach spot radius. c Diffusion coefficients and viscosities obtained from b. Mean and standard deviations are from at least two different samples with analysis from ≥14 bleach spots for each experiment