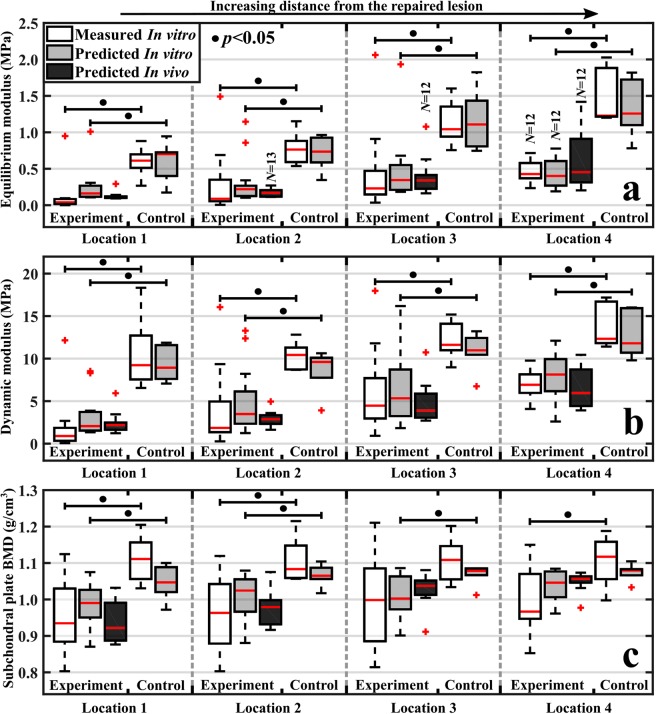
Figure 3.
Boxplots for experiment (post-traumatic) and control (healthy) groups with median (red line), quartiles (25% and 75%), and outliers (red cross) of in vitro measured (white bars) cartilage equilibrium modulus (a), dynamic modulus (b), and subchondral bone plate BMD (c) for the four locations at increasing distances from the lesion. Additionally, predictions based on the optimal model (Model 1) for in vitro and arthroscopic NIRS measurements are presented (grey and black bars, respectively). For each location, experiment and control groups had 12–14 and 6 measurements, respectively.

