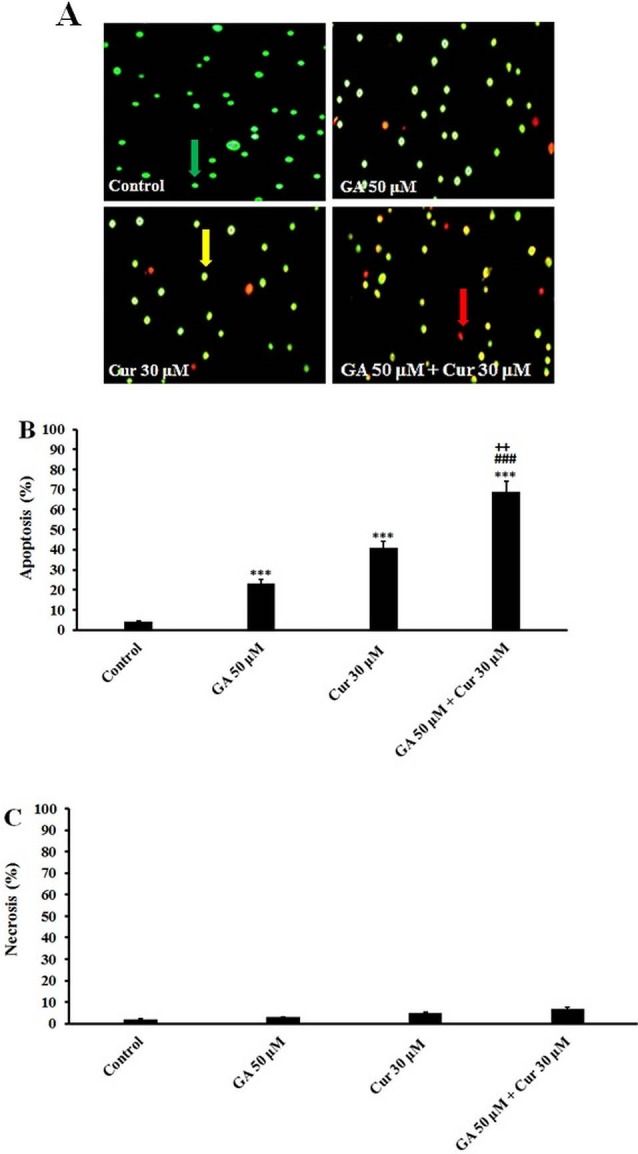
Fig. 2.

Acridine Orange/Ethidium Bromide Staining. A) Morphological changes in MDA-MB-231 cells after 48 h treatment with GA (50 μM) and Cur (30 μM). The cells were stained with Acridine orange and Ethidium bromide. Green cells indicate live cells; orange cells indicate apoptotic cells, and red cells indicate necrotic cells (×200). B) Apoptosis (%). C) Necrosis (%). The results are expressed as mean ± SEM (n=3), *** P<0.001 compared to control, ### P<0.001 compared to GA (50 μM), ++ P<0.01 compared to Cur (30 μM). The live, apoptotic, and necrotic cells were indicated by green, orange, and red arrows, respectively.
