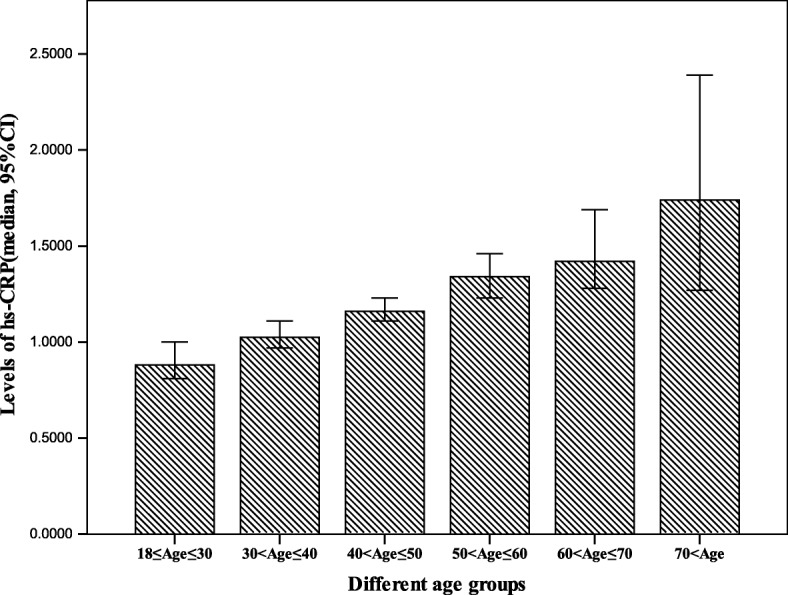
Fig. 1.

hs-CRP levels in different age groups. Each bar represents the median and 95%CI as indicated. *p < 0.05, ***p < 0.001 compared to the age subgroup of 18–30 year-old population

hs-CRP levels in different age groups. Each bar represents the median and 95%CI as indicated. *p < 0.05, ***p < 0.001 compared to the age subgroup of 18–30 year-old population