
Fig. 5. The pattern of regulation of fatty acid metabolism genes in Pparα-null mice by PFAA exhibits similarity to that induced by PPARγ agonists.
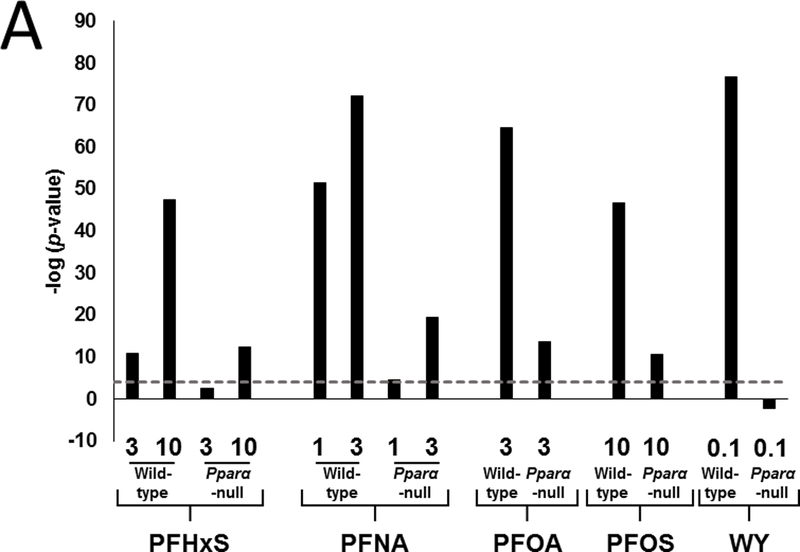
A. Similarity between PFAA-regulated genes and those regulated by the PPARγ agonist rosiglitazone. The gene lists derived from PFAA-treated mice were compared to the profiles from livers of db/db mice treated with rosiglitazone (Le Bouter et al., 2010).
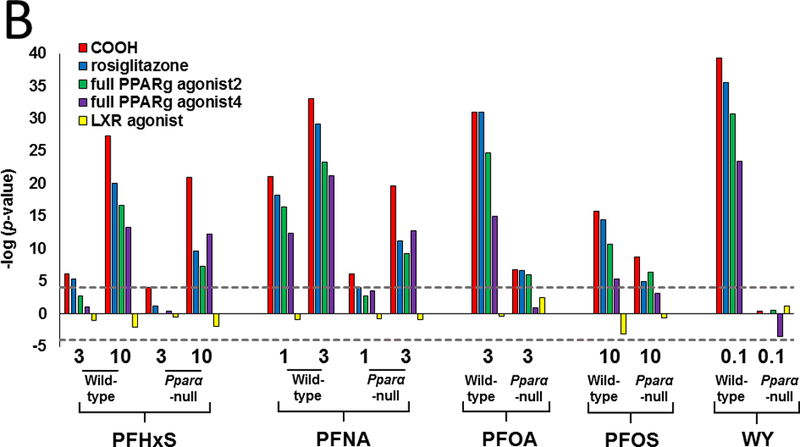
B. Similarity between PFAA-regulated genes and those regulated by four PPARγ agonists. Lists of significantly altered genes derived from exposure to one of the four indicated PPARγ agonists or a LXR agonist were compared to the PFAA groups. Mouse 3T3-L1 adipocytes were exposed to 10 uM of the indicated PPARγ agonists or LXR agonist for 24 hrs (Tan et al., 2012).
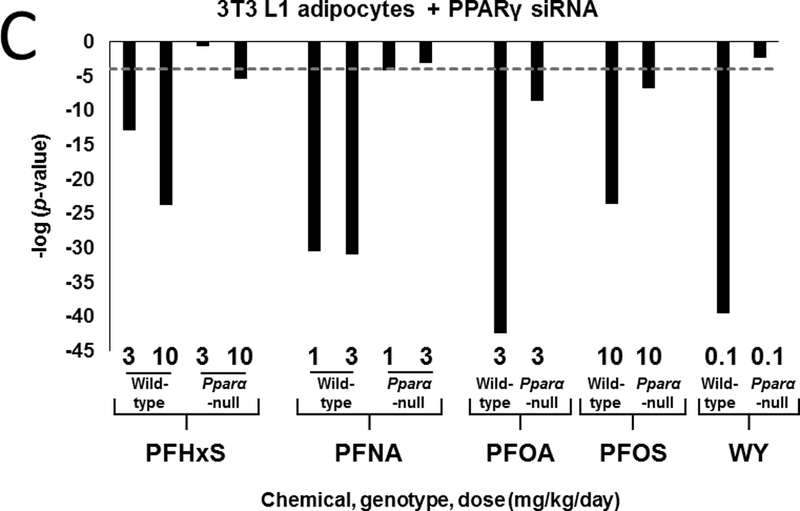
C. The PFAA profiles exhibit negative correlation to a profile of knockdown of the Pparg gene. The PFAA profiles were compared to the profile of 3T3-L1 cells treated with a siRNA against Pparg (Schupp et al., 2009).
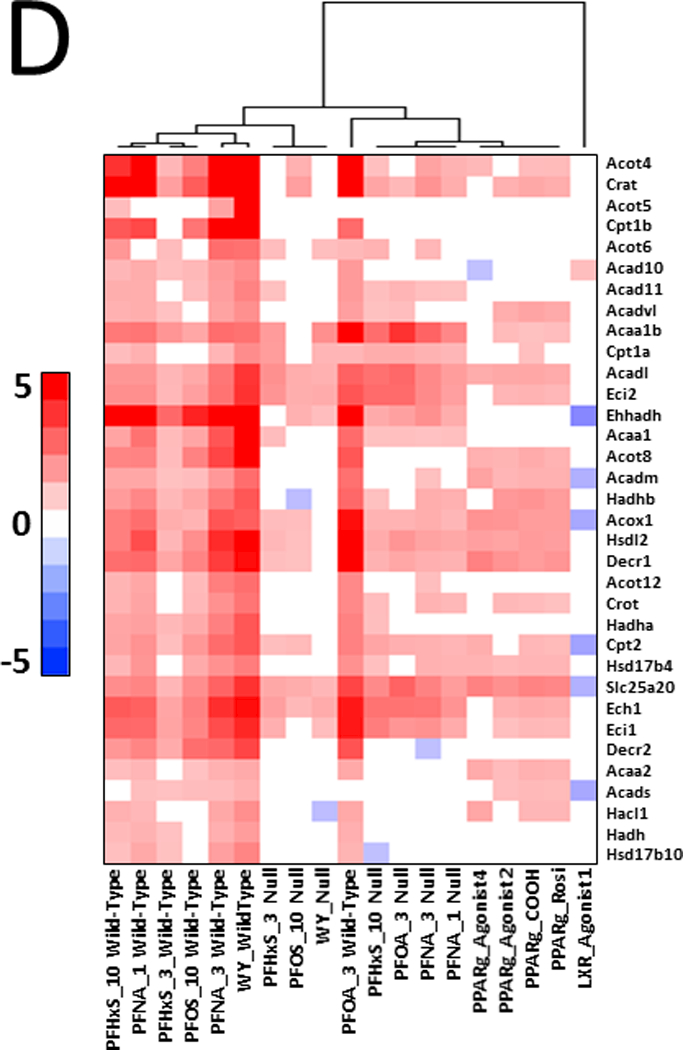
D. Similarity in the expression pattern of fatty β-oxidation genes between PFAAs in Pparα-null mice and PPARγ agonists. The expression of fatty acid β-oxidation genes was compared between the groups by two-dimensional hierarchical clustering and shows greater similarity in the expression pattern between the PPARγ agonists and PFAA from Pparα-null mice than from wild-type mice. Only the hierarchical tree of one dimension is shown.