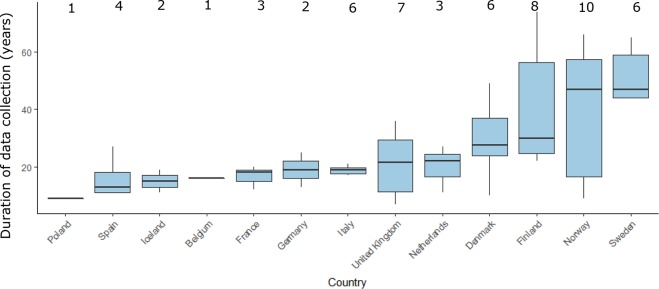
Figure 3.
European data sources and duration of data collection. Box plots indicate the median (horizontal black line) data collection time by country while the margins of the box plot represent the IQR, the vertical lines indicate the minimum and maximum values. The number of databases per country are provided above the box plots.

