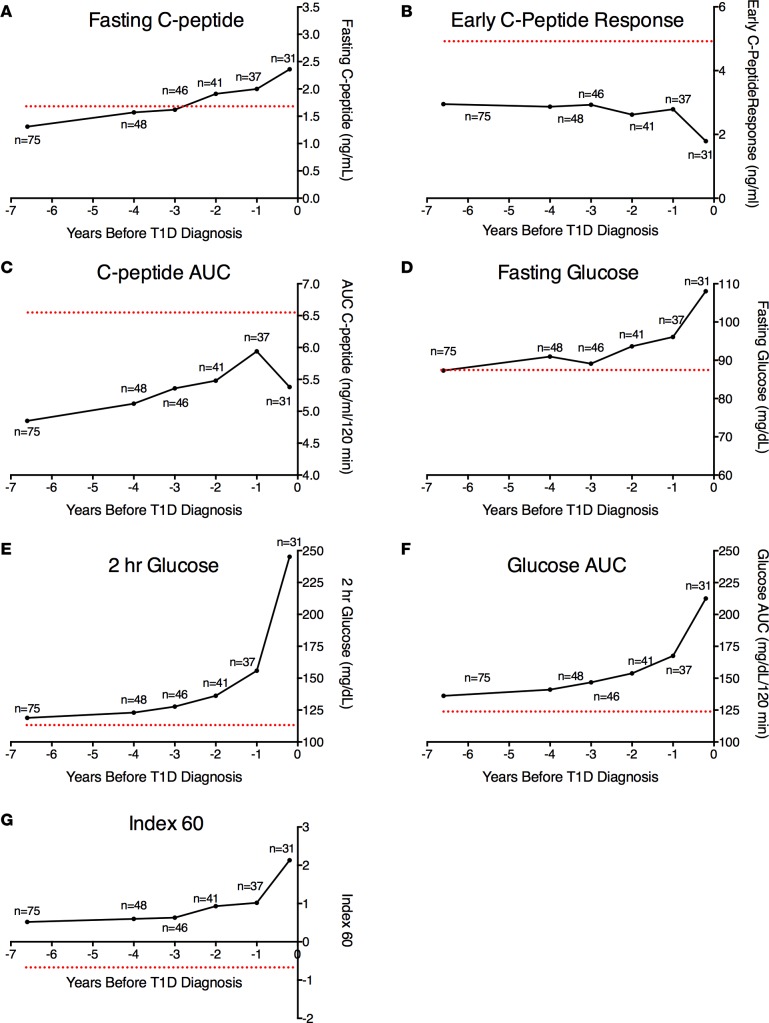
Figure 2. Longitudinal patterns of metabolic decline in Progressors≥5.
Shown are the mean values for the fasting C-peptide (A), early C-peptide response (B), C-peptide AUC (C), fasting glucose (D), 2-hour glucose (E), glucose AUC, (F) and Index60 (G) at baseline and then each year (±6 months) from 4 years to diagnosis for Progressors≥5. Also shown for reference are mean values of the aAb– individuals at baseline (red dotted line). Note that the aAb– control group (n = 144) was studied at a single time point, and the dotted line indicates the value obtained at this single time point. The number of Progressors≥5 with available data at each time point is indicated.

