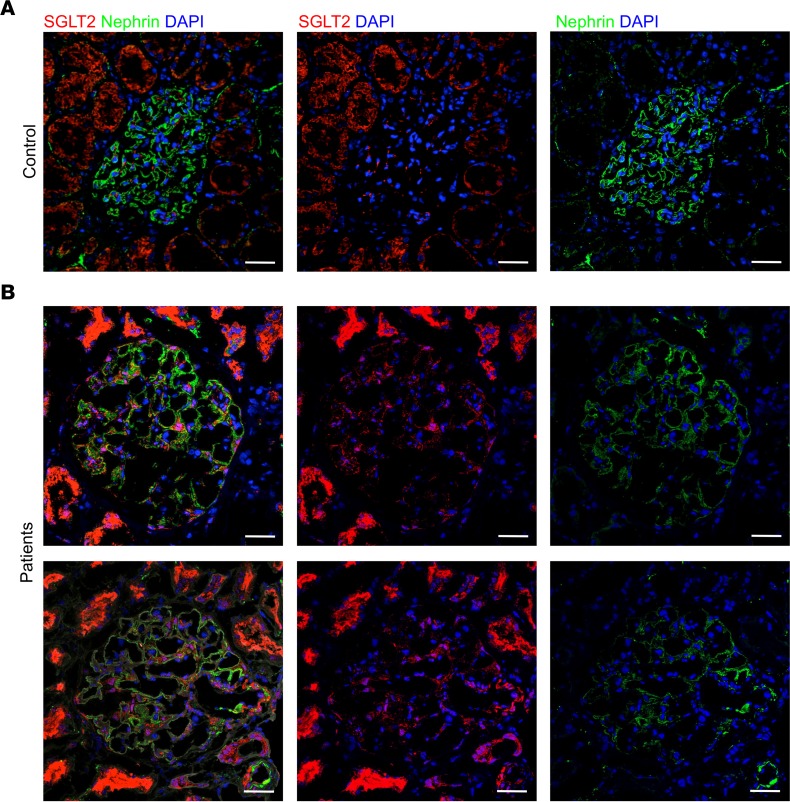
Figure 11. SGLT2 expression in renal biopsies of patients with idiopathic membranous nephropathy.
(A) Representative double immunofluorescence staining for SGLT2 (red) and nephrin (green) in normal control kidney (n = 3) and (B) in the renal biopsy of proteinuric patients with idiopathic membranous nephropathy (n = 4). DAPI (blue) stains nuclei. Scale bars: 20 μm.

