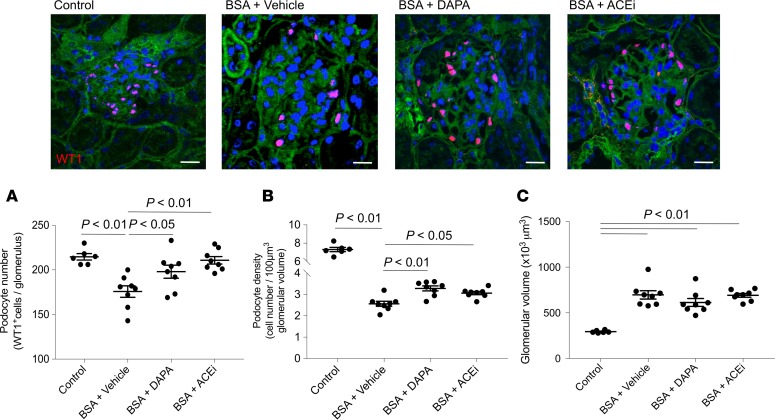
Figure 5. Dapagliflozin limits podocyte depletion in mice with protein-overload proteinuria.
Representative images and quantification of WT1-positive podocytes (red) expressed as number per glomerulus (A), podocyte density (B), and glomerular volume (C) in control mice (n = 6) and in BSA-mice treated with vehicle, dapagliflozin (DAPA), or ACE inhibitor (ACEi) (n = 8 each group), evaluated on day 23 after starting BSA. Scale bars: 20 μm. Data are the mean ± SEM and were analyzed by ANOVA with Tukey’s post hoc test.

