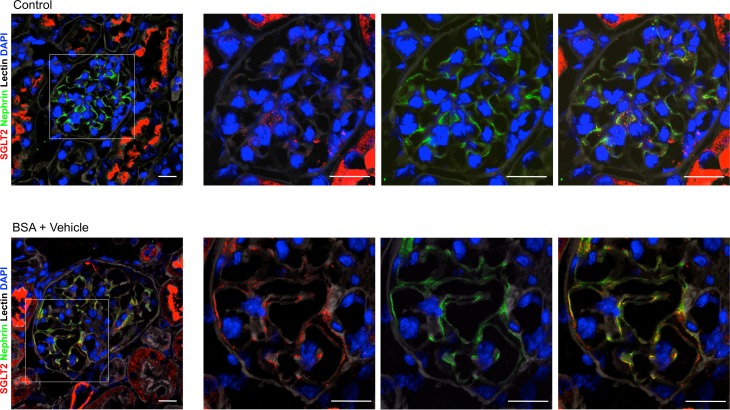
Figure 7. SGLT2 is expressed in podocytes and upregulated after BSA injections.
Representative images of renal tissue from control mice and mice treated with BSA showing merged area (yellow) of costaining of glomerular SGLT2 expression (red) and nephrin (green) in podocytes. Boxes indicate area of enlarged images to the right. Nuclei and cell membranes are stained with DAPI (blue) and Cy5-labeled lectin (gray), respectively. Scale bars: 20 μm.

