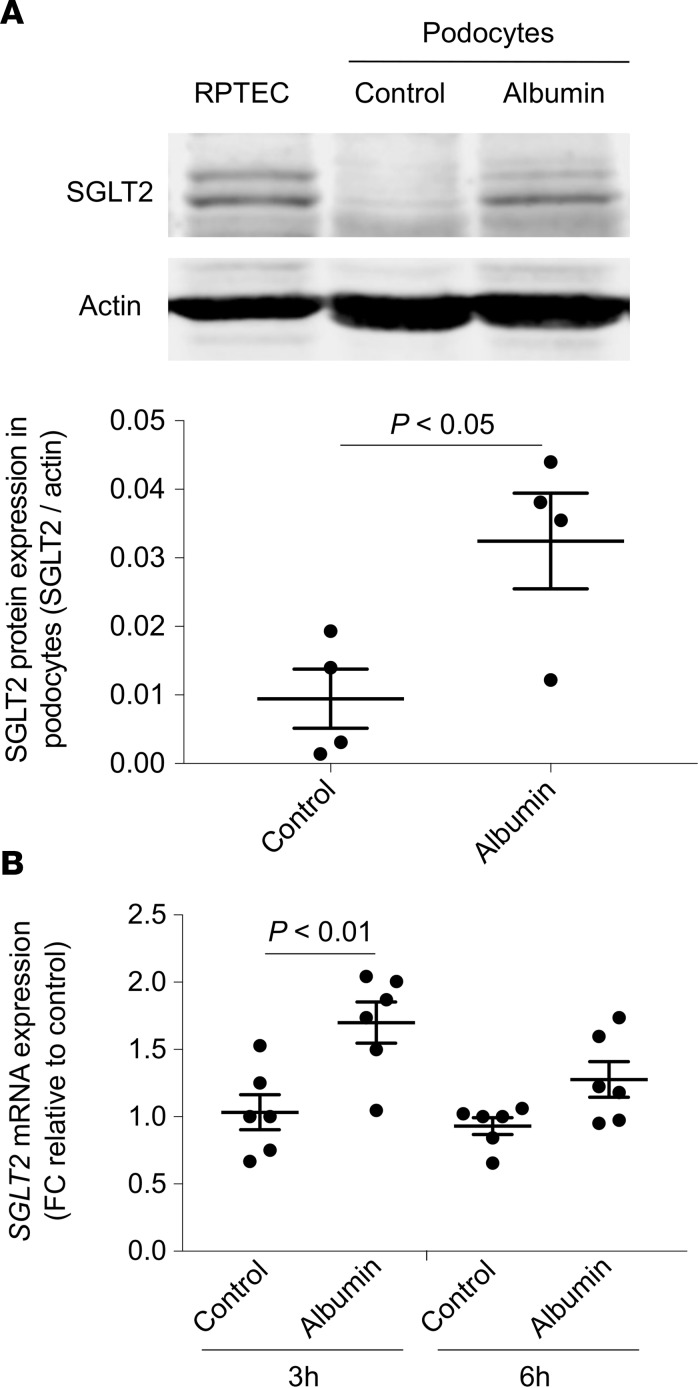
Figure 8. Human cultured podocytes express SGLT2 that is upregulated by albumin.
(A) Representative Western blot and densitometric analysis of SGLT2 protein in renal proximal tubular cells (RPTECs), used as positive control, and podocytes exposed to medium alone (control) or albumin (10 mg/ml, 6 hours). Actin was used as sample loading control. Data are the mean ± SEM (n = 4 samples) and were analyzed by Student’s t test. (B) SGLT2 mRNA expression evaluated by real-time qPCR analysis in podocytes exposed to medium alone (control) or albumin (10 mg/ml) for 3 and 6 hours. Hypoxanthine phosphoribosyltransferase 1 (HRPT1) was used as endogenous control. SGLT2 levels were normalized to HPRT1 levels and reported as fold change (FC) relative to the corresponding control. Data are the mean ± SEM (n = 6 samples) and were analyzed by ANOVA with Tukey’s post hoc test.

