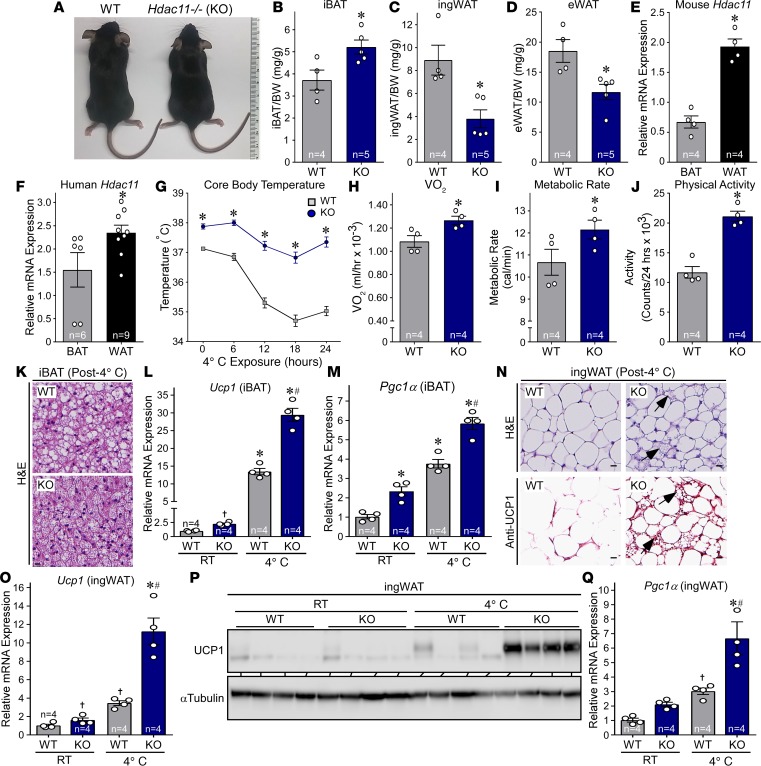
Figure 1. HDAC11 deficiency increases thermogenic potential in mice.
(A) Gross morphology of 10-week-old male WT and Hdac11–/– (KO) littermates fed standard rodent chow. (B–D) iBAT, ingWAT, and eWAT from 10-week-old male mice were dissected and weighed. n = 4 WT, n = 5 KO. (E and F) qPCR analysis of Hdac11 mRNA expression in mouse and human BAT and WAT. E: n = 4, BAT and WAT, ; F: n = 6 BAT, n = 9 WAT. (G) WT and KO mice were fed standard rodent chow and exposed to 4°C for 24 hours, and core body temperature was recorded at the indicated time points using a rectal thermal probe; n = 4 mice/group. (H and I) Oxygen consumption (VO2) and metabolic rate (MR) were measured using a CLAMS system for 24 hours. (J) Activity was calculated using laser beam breaks per 24 hours. H–J: n = 4 mice/group. (K) H&E staining of iBAT after 24 hours of 4°C exposure. Scale bar: 50 μm. (L and M) Quantitative PCR analysis of Ucp1 and Pgc1α mRNA expression in iBAT from mice housed at room temperature (RT) or exposed to 4°C for 24 hours; n = 4 mice/group. (N) H&E staining and UCP1 immunohistochemistry of ingWAT 24 hours after 4°C exposure. Arrows indicate evidence of beiging. Scale bars: 50 μm. (O) qPCR analysis of Ucp1 mRNA expression in ingWAT; n = 4 mice/group. (P) Immunoblot analysis of UCP1 protein expression in ingWAT. (Q) qPCR analysis of Pgc1α mRNA expression in ingWAT; n = 4 mice/group. Values for all graphs represent mean ± SEM; *P < 0.05 vs. WT (or BAT for E and F), #P < 0.05 vs. WT 4°C using ANOVA with Tukey’s multiple-comparisons test. Student’s t test was employed for 2 groups, and †P < 0.05 vs. WT RT; unpaired Student’s t test was employed for 2 groups, after ANOVA indicated significance.

