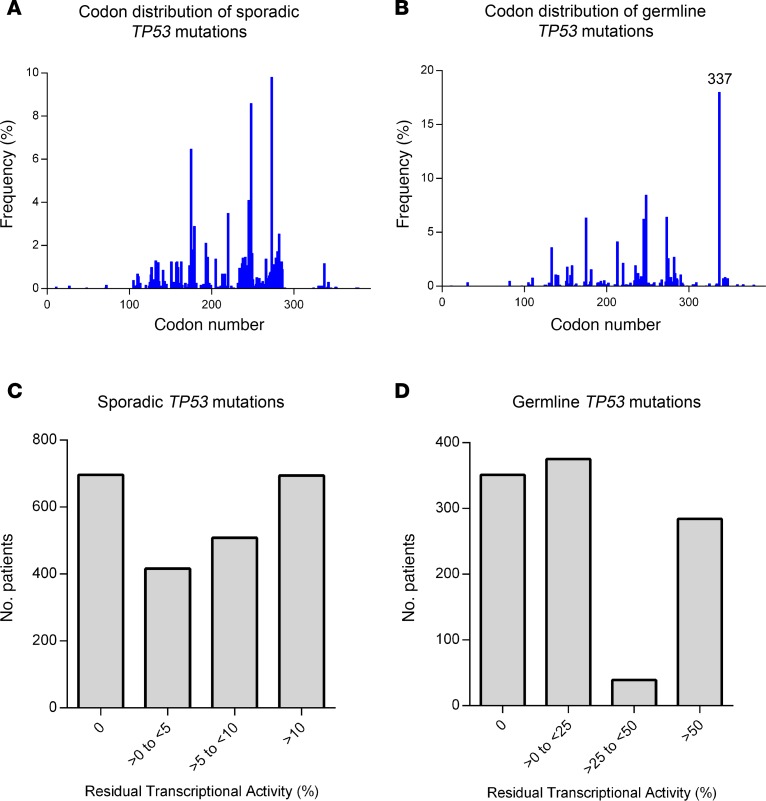
Figure 2. Codon distribution, frequencies and transcriptional spectrum of sporadic and germline TP53 mutations.
(A and B) The codon distribution and frequencies of TP53 missense mutations in the sporadic (n = 2,314) (A) and germline (n = 1,049) (B) datasets from the current analysis. (C and D) Histogram displaying the range of residual transcriptional activity associated with TP53 mutations observed in patients from the sporadic (C) and germline (D) datasets.

