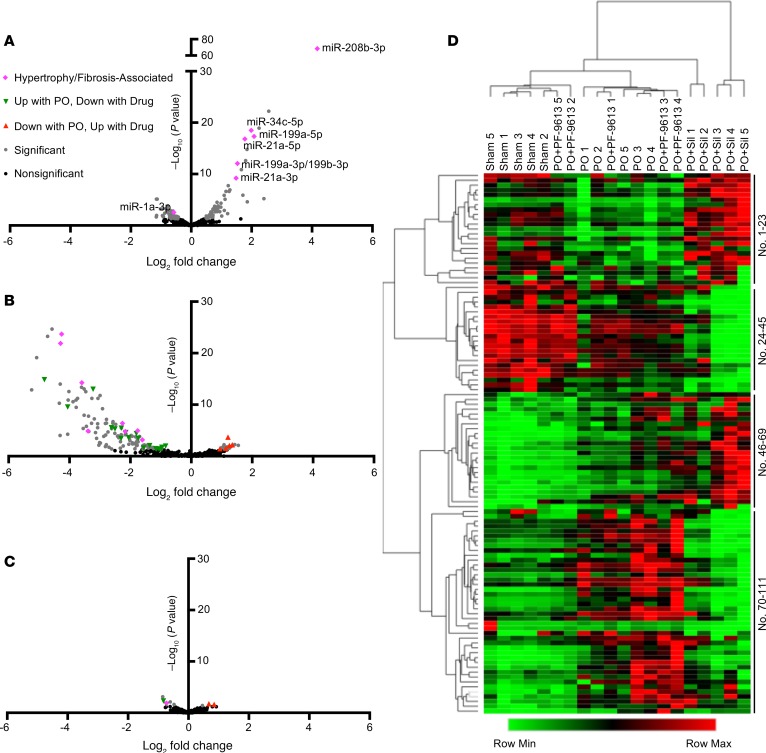
Figure 1. PDE5-I and PDE9-I applied to PO heart yield disparate miR profiles.
Left ventricular myocardium from mice subjected to sham or PO surgery and subsequently given either vehicle, PDE5-I (Sil), or PDE9-I (PF-9613) were subjected to miR sequencing and subsequent differential expression analysis (n = 5 per group). (A) Volcano plot of miRs altered in PO versus sham, with miRs relevant to cardiac hypertrophy/fibrosis labeled. (B) Volcano plot of miRs altered in PO+Sil versus PO. (C) Volcano plot of miRs altered in PO+PF-9613 versus PO. For all volcano plots, dark gray dots indicate differentially expressed miRs; green triangles indicate miRs increased with PO, and decreased with drug treatment; red triangles indicate miRs decreased with PO, and increased with drug treatment; and pink diamonds indicate miRs labeled in panel A that are associated with cardiac hypertrophy and fibrosis (legend can be found in panel C). (D) Heatmap of all miRs changed significantly with PO for all treatment groups, clustered by both rows (miRs) and columns (samples). Row labels (i.e., miR names) can be found in Supplemental Table 4.

