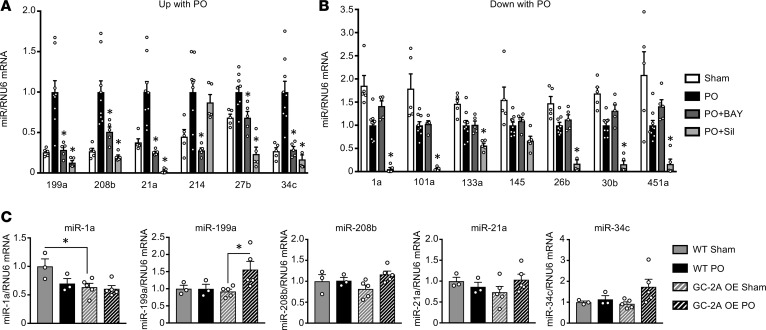
Figure 4. Effect on miRs from alternative stimulation of GC-1 or GC-2A signaling.
(A and B) Left ventricular myocardium from mice subjected to sham or PO surgery and subsequently given either vehicle, PDE5-I (Sil), or an sGC activator (BAY 60-2770) were analyzed by qRT-PCR for (A) prohypertrophic miRs and (B) antihypertrophic miRs. Sil downregulates both categories of miRs, whereas BAY downregulates only prohypertrophic miRs. n = 4–11 per group. *P < 0.05 compared with PO for Sil and BAY analysis (smaller P values are not differentiated by different symbols, though some comparisons were very significant). (C) Mice overexpressing GC-2A and WT littermate controls were subjected to sham or PO surgery (n = 3–5 per group). Myocardial tissue was used for qRT-PCR analysis of miRs. *P < 0.05 as compared with the indicated group for GC-2A analysis. All data are presented as the mean ± SEM. Data were analyzed using 1-way ANOVA with Dunnett’s post hoc test, or Kruskal-Wallis test with Dunn’s post hoc test.

