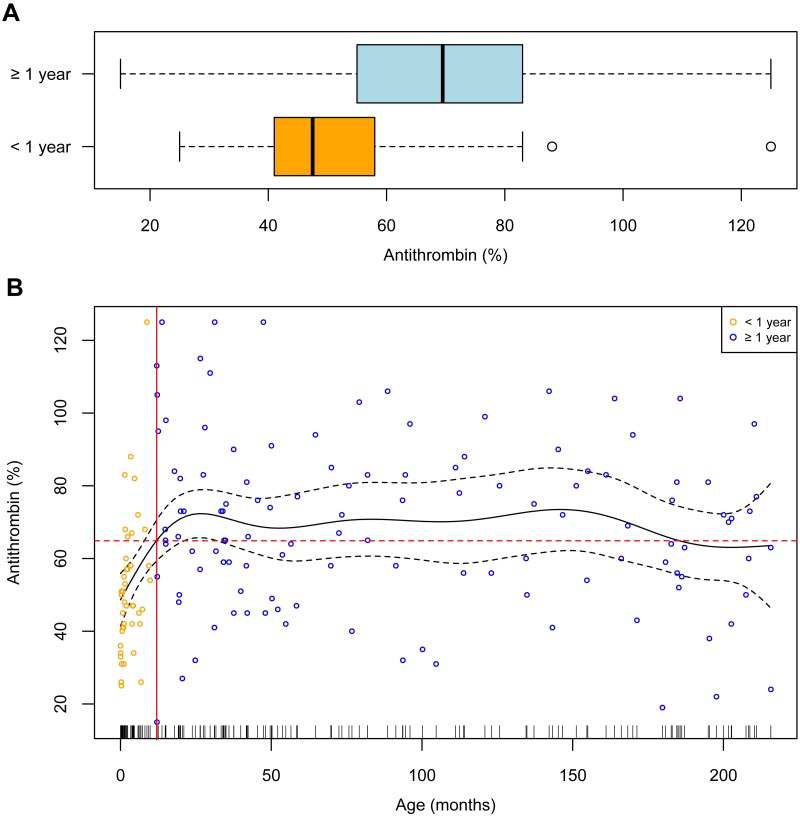
Figure 1. Relationship between antithrombin levels and age.
(A) Boxplots of antithrombin levels for patients younger (<1 year) and older than one year (≥1 year). (B) Smoothing spline (black solid line) with 95% CI (dashed black lines). The solid red line marks 12 months of age and the dashed red line corresponds to the mean antithrombin level of 64.87%.

