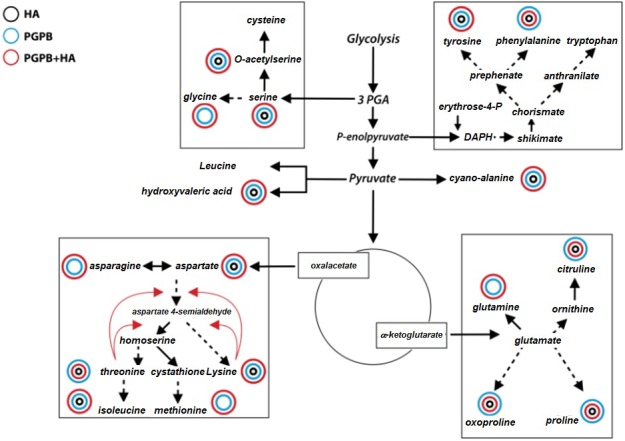
Figure 1. Schematic representation of the effect of the treatments on the levels of amino acids in respect to control.

Schematic representation of the effect of the treatments on the levels of amino acids in respect to control. Rectangles containing aminoacids pools that derivates from pathways conversions of 3-phosphoglycerate (PGA), P-enolpyruvate, pyruvate, oxaloacetate and α-ketoglutarate. Aminoacids with significant higher values related to control had shown color circles. The color circles represent the treatments (HA, black; PGPB, blue, HA+PGPB, red) and the magnitude of influence of each treatment in respect to control is represented by the size of the circle.
