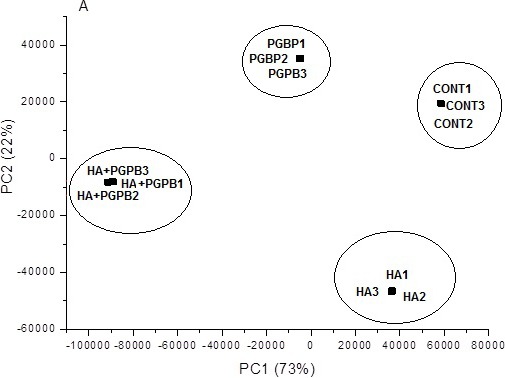
Figure 2. PCA scores for CG-MS metabolic profile data.

PCA scores for CG-MS data indicating good separation of treatments in different groups according to bacteria inoculation (PGPB), humic acid (HA) application or its combined use (HA+PGPB) for metabolomic profiles, as well as good agreement among biological replicates. The loadings and their coefficient weight that indicate the position of the variables along the PCs and consequently their importance for that PC are shown in Supplemental Information 1.
