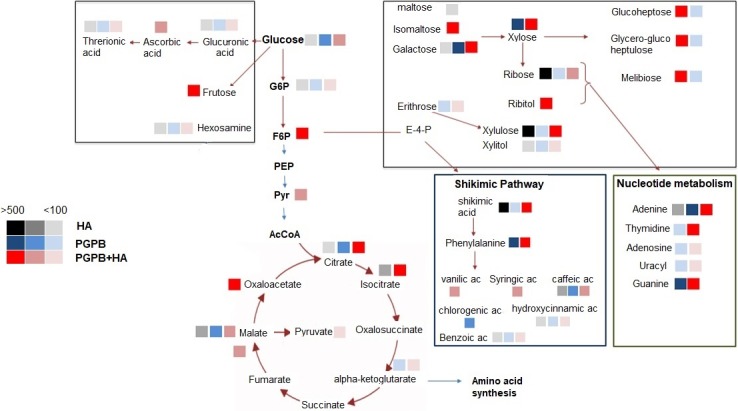
Figure 3. General view of the most important metabolites identified on main sugarcane biochemical pathways.

Representation of the most important metabolites identified on main sugarcane biochemical pathways. The color squares represent the treatments (HA, black; PGPB, blue, HA+PGPB: red) and the increase of concentration level (% in respect to control) was ranked according to the color-coded scale bar that range from 100 to 500× times concentration related to control plants.
