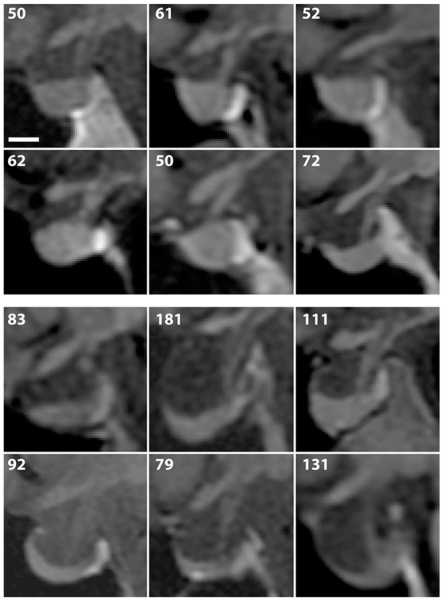
Fig. 2.

Upper: Midsagittal T1-weighted MR images showing examples of the sella turcica in 6 control subjects. The number in the upper left of each image represents the sellar area in mm2. Lower: Midsagittal MR images obtained from 6 patients with pseudotumor cerebri, demonstrating variable enlargement and partially empty sellas. Bar = 5 mm.
